Difference between revisions of "Graphics Render Examples"
Jump to navigation
Jump to search
(Created page with "=Graphics Render Examples= Here are some more Render Examples. == Cardioid Examples == Following the "the midpoints of the circles lie on the perimeter of the fixed genera...") |
|||
| Line 30: | Line 30: | ||
</pre> | </pre> | ||
[[File:Wki cycloid1.jpg|thumb|Cycloid (fig.1)]] | [[File:Wki cycloid1.jpg|thumb|Cycloid (fig.1)]] | ||
| + | |||
| + | <pre> | ||
| + | ==Example 2 == | ||
| + | numpoints=50; | ||
| + | pts=MAKEPOLYGONPOINTS(numpoints,[30,50],[200,200], 150) | ||
| + | start=pts[0]; | ||
| + | circlesat1= | ||
| + | pts | ||
| + | .map( | ||
| + | p=>[p[0],p[1],SQRT(POWER(p[0]-start[0],2)+POWER(p[1]-start[1],2))] | ||
| + | ) | ||
| + | |||
| + | pts=MAKEPOLYGONPOINTS(numpoints,[70,70],[500,200], 0) | ||
| + | start=pts[0]; | ||
| + | |||
| + | circlesat2= | ||
| + | pts | ||
| + | .map( | ||
| + | p=>[p[0],p[1],SQRT(POWER(p[0]-start[0],2)+POWER(p[1]-start[1],2))] | ||
| + | ) | ||
| + | |||
| + | cycloids = RENDER( | ||
| + | [ | ||
| + | ["id","type","cx","cy","r","stroke","stroke-width","count"], | ||
| + | ["cycloid1","circle",circlesat1.column(1),circlesat1.column(0),circlesat1.column(2),"red",1,circlesat1.length], | ||
| + | ["cycloid2","circle",circlesat2.column(1),circlesat2.column(0),circlesat2.column(2),"red",1,circlesat2.length] | ||
| + | ] | ||
| + | ) | ||
| + | ; | ||
| + | RENDER( | ||
| + | [ | ||
| + | ["id" , "animate","animationsettings"], | ||
| + | ["cycloid1" , "animate",[["loop","rotate","duration","easing"],[true,-360,5*1000,"linear"]]] , | ||
| + | ["cycloid2" , "animate",[["loop","rotate","duration","easing"],[true,360,5*1000,"linear"]]] | ||
| + | ] | ||
| + | , | ||
| + | cycloids | ||
| + | ) | ||
| + | "" | ||
| + | </pre> | ||
| + | [[File:Wki cycloid2.jpg|thumb|left|Two Cycloids]] | ||
Revision as of 23:56, 20 October 2020
Graphics Render Examples
Here are some more Render Examples.
Cardioid Examples
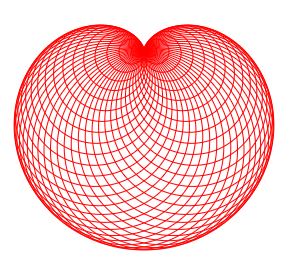
Following the "the midpoints of the circles lie on the perimeter of the fixed generator circle" method to draw a cardioid:
1) Choose a circle c and a point p on its perimeter, 2) Draw circles containing point p with centers on the perimeter of circle c
Example 1
numpoints=50;
pts=MAKEPOLYGONPOINTS(numpoints,[50,50],[200,200], 270)
start=pts[0];
circlesat=
	pts
		.map(
			p=>[p[0],p[1],SQRT(POWER(p[0]-start[0],2)+POWER(p[1]-start[1],2))]
		)

RENDER(
	[
		["type","cx","cy","r","stroke","stroke-width","count"],
		["circle",circlesat.column(0),circlesat.column(1),circlesat.column(2),"red",1,circlesat.length]
	]
)
""
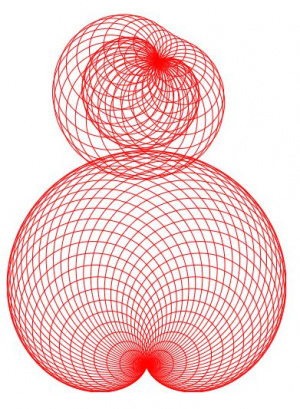
==Example 2 ==
numpoints=50;
pts=MAKEPOLYGONPOINTS(numpoints,[30,50],[200,200], 150)
start=pts[0];
circlesat1=
	pts
		.map(
			p=>[p[0],p[1],SQRT(POWER(p[0]-start[0],2)+POWER(p[1]-start[1],2))]
		)

pts=MAKEPOLYGONPOINTS(numpoints,[70,70],[500,200], 0)
start=pts[0];

circlesat2=
	pts
		.map(
			p=>[p[0],p[1],SQRT(POWER(p[0]-start[0],2)+POWER(p[1]-start[1],2))]
		)

cycloids = RENDER(
	[
		["id","type","cx","cy","r","stroke","stroke-width","count"],
		["cycloid1","circle",circlesat1.column(1),circlesat1.column(0),circlesat1.column(2),"red",1,circlesat1.length],
		["cycloid2","circle",circlesat2.column(1),circlesat2.column(0),circlesat2.column(2),"red",1,circlesat2.length]
	]
)
;
RENDER(
	[
		["id"		, "animate","animationsettings"],
		["cycloid1"	, "animate",[["loop","rotate","duration","easing"],[true,-360,5*1000,"linear"]]]	,
		["cycloid2"	, "animate",[["loop","rotate","duration","easing"],[true,360,5*1000,"linear"]]]
	]
	,
	cycloids
)
""

