Difference between revisions of "Graphics Render Examples"
Jump to navigation
Jump to search
| Line 2: | Line 2: | ||
== Line and Triangle Examples == | == Line and Triangle Examples == | ||
| + | |||
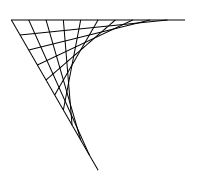
| + | [[File:Lines3-1.jpg|thumb|left|Joining Points on intersecting lines]] | ||
<pre> | <pre> | ||
| Line 17: | Line 19: | ||
"" | "" | ||
</pre> | </pre> | ||
| − | |||
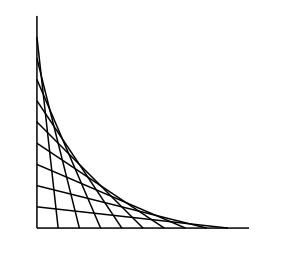
| + | [[File:Lines-poly4-lines0.jpg|thumb|left]] | ||
<pre> | <pre> | ||
pointcoords=POLYPOINTS(4,100,100); | pointcoords=POLYPOINTS(4,100,100); | ||
| Line 34: | Line 36: | ||
"" | "" | ||
</pre> | </pre> | ||
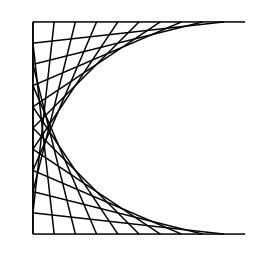
| − | [[File:Lines-poly4- | + | [[File:Lines-poly4-lines12.jpg|thumb|left]] |
<pre> | <pre> | ||
| Line 52: | Line 54: | ||
"" | "" | ||
</pre> | </pre> | ||
| − | |||
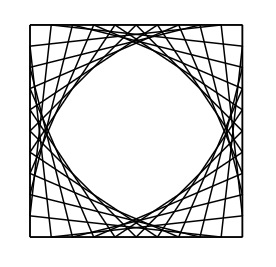
| + | [[File:Lines-poly4-lines01234.jpg|thumb|left]] | ||
<pre> | <pre> | ||
pointcoords=POLYPOINTS(4,100,100); | pointcoords=POLYPOINTS(4,100,100); | ||
| Line 72: | Line 74: | ||
"" | "" | ||
</pre> | </pre> | ||
| − | |||
| + | [[File:Lines-poly4-lines01234+cage0213.jpg|thumb|left]] | ||
<pre> | <pre> | ||
pointcoords=POLYPOINTS(4,100,100); | pointcoords=POLYPOINTS(4,100,100); | ||
| Line 96: | Line 98: | ||
"" | "" | ||
</pre> | </pre> | ||
| − | |||
Revision as of 16:17, 21 October 2020
Graphics Render Examples
Line and Triangle Examples
pointcoords=POLYPOINTS(3,100,100);
s=LINESPLIT(pointcoords,10,true)
lines1=(s[0].rowpush(s[1])).m(r=>r.flatten())
lines2=(s[1].rowpush(s[2])).m(r=>r.flatten())
lines3=(s[2].rowpush(s[0])).m(r=>r.flatten())
var d=	[
		["type","coordinates","count"],
		["line",lines1,lines1.length],
	]

RENDER(d)
""
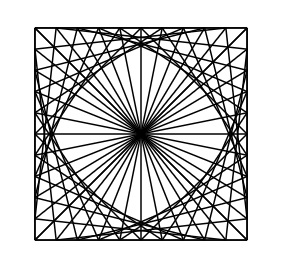
pointcoords=POLYPOINTS(4,100,100);
s=LINESPLIT(pointcoords,10,true)
lines1=(s[0].rowpush(s[1])).m(r=>r.flatten())
lines2=(s[1].rowpush(s[2])).m(r=>r.flatten())
lines3=(s[2].rowpush(s[3])).m(r=>r.flatten())
lines4=(s[3].rowpush(s[0])).m(r=>r.flatten())
var d=	[
		["type","coordinates","count"],
		["line",lines1,lines1.length]
	]

RENDER(d)
""
pointcoords=POLYPOINTS(4,100,100);
s=LINESPLIT(pointcoords,10,true)
lines1=(s[0].rowpush(s[1])).m(r=>r.flatten())
lines2=(s[1].rowpush(s[2])).m(r=>r.flatten())
lines3=(s[2].rowpush(s[3])).m(r=>r.flatten())
lines4=(s[3].rowpush(s[0])).m(r=>r.flatten())
var d=	[
		["type","coordinates","count"],
		["line",lines1,lines1.length],
		["line",lines2,lines2.length],
	]

RENDER(d)
""
pointcoords=POLYPOINTS(4,100,100);
s=LINESPLIT(pointcoords,10,true)
lines1=(s[0].rowpush(s[1])).m(r=>r.flatten())
lines2=(s[1].rowpush(s[2])).m(r=>r.flatten())
lines3=(s[2].rowpush(s[3])).m(r=>r.flatten())
lines4=(s[3].rowpush(s[0])).m(r=>r.flatten())
var d=	[
		["type","coordinates","count"],
		["line",lines1,lines1.length],
		["line",lines2,lines2.length],
		["line",lines3,lines3.length],
		["line",lines4,lines4.length]
	]

RENDER(d)
""
pointcoords=POLYPOINTS(4,100,100);
s=LINESPLIT(pointcoords,10,true)
lines1=(s[0].rowpush(s[1])).m(r=>r.flatten())
lines2=(s[1].rowpush(s[2])).m(r=>r.flatten())
lines3=(s[2].rowpush(s[3])).m(r=>r.flatten())
lines4=(s[3].rowpush(s[0])).m(r=>r.flatten())
lines5=(s[2].rowpush(s[0])).m(r=>r.flatten())
lines6=(s[1].rowpush(s[3])).m(r=>r.flatten())
var d=	[
		["type","coordinates","count"],
		["line",lines1,lines1.length],
		["line",lines2,lines2.length],
		["line",lines3,lines3.length],
		["line",lines4,lines4.length],
		["line",lines5,lines5.length],
		["line",lines6,lines6.length]
	]

RENDER(d)
""
Cardioid Examples
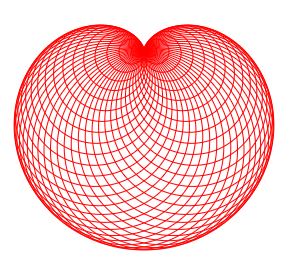
Following the "the midpoints of the circles lie on the perimeter of the fixed generator circle" method to draw a cardioid:
1) Choose a circle c and a point p on its perimeter, 2) Draw circles containing point p with centers on the perimeter of circle c
Example 1
numpoints=50;
pts=MAKEPOLYGONPOINTS(numpoints,[50,50],[200,200], 270)
start=pts[0];
circlesat=
	pts
		.map(
			p=>[p[0],p[1],SQRT(POWER(p[0]-start[0],2)+POWER(p[1]-start[1],2))]
		)

RENDER(
	[
		["type","cx","cy","r","stroke","stroke-width","count"],
		["circle",circlesat.column(0),circlesat.column(1),circlesat.column(2),"red",1,circlesat.length]
	]
)
""
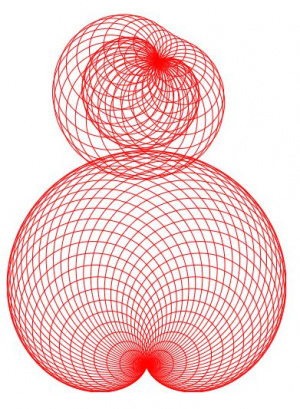
Example 2
numpoints=50;
pts=MAKEPOLYGONPOINTS(numpoints,[30,50],[200,200], 150)
start=pts[0];
circlesat1=
	pts
		.map(
			p=>[p[0],p[1],SQRT(POWER(p[0]-start[0],2)+POWER(p[1]-start[1],2))]
		)

pts=MAKEPOLYGONPOINTS(numpoints,[70,70],[500,200], 0)
start=pts[0];

circlesat2=
	pts
		.map(
			p=>[p[0],p[1],SQRT(POWER(p[0]-start[0],2)+POWER(p[1]-start[1],2))]
		)

cycloids = RENDER(
	[
		["id","type","cx","cy","r","stroke","stroke-width","count"],
		["cycloid1","circle",circlesat1.column(1),circlesat1.column(0),circlesat1.column(2),"red",1,circlesat1.length],
		["cycloid2","circle",circlesat2.column(1),circlesat2.column(0),circlesat2.column(2),"red",1,circlesat2.length]
	]
)
;
RENDER(
	[
		["id"		, "animate","animationsettings"],
		["cycloid1"	, "animate",[["loop","rotate","duration","easing"],[true,-360,5*1000,"linear"]]]	,
		["cycloid2"	, "animate",[["loop","rotate","duration","easing"],[true,360,5*1000,"linear"]]]
	]
	,
	cycloids
)
""
