Difference between revisions of "RENDER Examples"
| (28 intermediate revisions by 4 users not shown) | |||
| Line 4: | Line 4: | ||
=ZCubes Render Examples= | =ZCubes Render Examples= | ||
| − | ZCubes Render feature allows users to make fascinatingly complex drawings and animations by simply using the spreadsheet, array or table features. | + | ZCubes Render feature allows users to make fascinatingly complex drawings and animations by simply using the spreadsheet, array or table features. To apply render to the last element, use RENDERX function. |
==Example 1: Two Circles== | ==Example 1: Two Circles== | ||
| Line 10: | Line 10: | ||
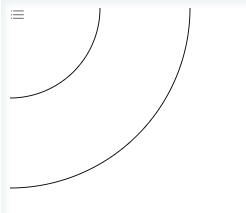
Draw two circles with radii as given. | Draw two circles with radii as given. | ||
| − | < | + | <syntaxhighlight lang="javascript"> |
RENDER( | RENDER( | ||
[ | [ | ||
| Line 18: | Line 18: | ||
] | ] | ||
) | ) | ||
| − | </ | + | </syntaxhighlight> |
| − | [[File: | + | [[File:Render_Two_Circles.png]] |
| + | |||
| + | Input data to render can also be given in alternative object formats or vertical formats. | ||
| + | [[Alternative_RENDER_Input_Formats|Alternative formats]] | ||
==Example 2: Ten Circles== | ==Example 2: Ten Circles== | ||
| Line 26: | Line 29: | ||
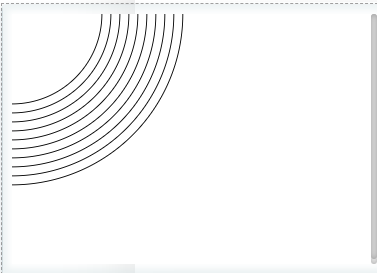
Draw ten circles with radii as per the function given. Note that each ith circle will have the radius as given by the function. Note the use of count column to specify the number of circles to be generated. | Draw ten circles with radii as per the function given. Note that each ith circle will have the radius as given by the function. Note the use of count column to specify the number of circles to be generated. | ||
| − | < | + | <syntaxhighlight lang="javascript"> |
RENDER( | RENDER( | ||
[ | [ | ||
| Line 34: | Line 37: | ||
) | ) | ||
"" | "" | ||
| − | </ | + | </syntaxhighlight> |
| + | |||
[[File:Render_Ten_Circles.png]] | [[File:Render_Ten_Circles.png]] | ||
| Line 41: | Line 45: | ||
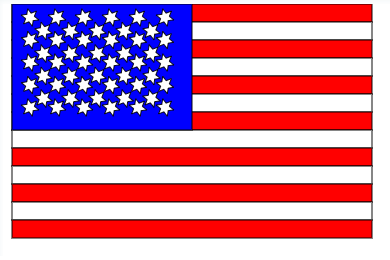
Generating American Flag using RENDER feature. | Generating American Flag using RENDER feature. | ||
| − | |||
// american flag 4 final | // american flag 4 final | ||
| + | <syntaxhighlight lang="javascript"> | ||
RENDER( | RENDER( | ||
[ | [ | ||
| Line 54: | Line 58: | ||
) | ) | ||
"" | "" | ||
| − | </ | + | </syntaxhighlight> |
[[File:Render_American_Flag.png]] | [[File:Render_American_Flag.png]] | ||
| Line 60: | Line 64: | ||
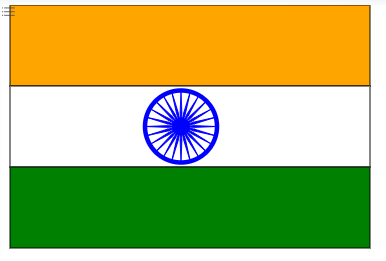
Generating Indian Flag using RENDER feature. | Generating Indian Flag using RENDER feature. | ||
| − | |||
| + | |||
| + | <syntaxhighlight lang="javascript"> | ||
RENDER( | RENDER( | ||
[ | [ | ||
| Line 72: | Line 77: | ||
); | ); | ||
"" | "" | ||
| − | </ | + | </syntaxhighlight> |
[[File:Render_Indian_Flag.png]] | [[File:Render_Indian_Flag.png]] | ||
==Example 5: Graphics Model== | ==Example 5: Graphics Model== | ||
| − | < | + | <syntaxhighlight lang="javascript"> |
x=500..0..-10 | x=500..0..-10 | ||
a=x.mergerows(0..0); | a=x.mergerows(0..0); | ||
| Line 87: | Line 92: | ||
RENDER(e,ab) | RENDER(e,ab) | ||
"" | "" | ||
| − | </ | + | </syntaxhighlight> |
| − | |||
[[File:Render_Merge_Rows.png]] | [[File:Render_Merge_Rows.png]] | ||
| Line 94: | Line 98: | ||
Magic Square Number Array Size Comparison | Magic Square Number Array Size Comparison | ||
| − | < | + | <syntaxhighlight lang="javascript"> |
| + | |||
RENDER( | RENDER( | ||
[ | [ | ||
| Line 102: | Line 107: | ||
) | ) | ||
"" | "" | ||
| + | </syntaxhighlight> | ||
| − | |||
| − | |||
[[File:Render_Magic_Square_Number_Array_Size_Comparison.png]] | [[File:Render_Magic_Square_Number_Array_Size_Comparison.png]] | ||
==Example 7 :Animation Demo== | ==Example 7 :Animation Demo== | ||
Animation Demo | Animation Demo | ||
| − | < | + | <syntaxhighlight lang="javascript"> |
RENDER( | RENDER( | ||
[ | [ | ||
| Line 154: | Line 158: | ||
] | ] | ||
) | ) | ||
| − | </ | + | </syntaxhighlight> |
[[File:Render_Animation_Demo.png]] | [[File:Render_Animation_Demo.png]] | ||
| Line 160: | Line 164: | ||
==Example 8: Circles at Polygon Points== | ==Example 8: Circles at Polygon Points== | ||
Circles at Polygon Points | Circles at Polygon Points | ||
| − | < | + | <syntaxhighlight lang="javascript"> |
// circle around polygon points | // circle around polygon points | ||
pts=MAKEPOLYGONPOINTS(50,200) | pts=MAKEPOLYGONPOINTS(50,200) | ||
| Line 170: | Line 174: | ||
) | ) | ||
"" | "" | ||
| − | </ | + | </syntaxhighlight> |
| + | |||
[[File:Render_Circles_at_Poly_Points.png]] | [[File:Render_Circles_at_Poly_Points.png]] | ||
| + | |||
| + | <syntaxhighlight lang="javascript"> | ||
| + | // nics circles around polygon points | ||
| + | pts=MAKEPOLYGONPOINTS(50,200) | ||
| + | RENDER( | ||
| + | [ | ||
| + | ["type","cx","cy","r","stroke","stroke-width","fill","count"], | ||
| + | ["circle",i=>300+pts[i][0],i=>300+pts[i][1],100,"black",1,i=>"transparent",pts.length] | ||
| + | ] | ||
| + | ) | ||
| + | "" | ||
| + | </syntaxhighlight> | ||
| + | [[File:Render_Nics_Circles_Around_Poly_Points.png]] | ||
| + | |||
| + | |||
| + | <syntaxhighlight lang="javascript"> | ||
| + | // circle around polygon points | ||
| + | pts=MAKEPOLYGONPOINTS(50,200) | ||
| + | .concat(MAKEPOLYGONPOINTS(50,100)) | ||
| + | RENDER( | ||
| + | [ | ||
| + | ["type","cx","cy","r","stroke","stroke-width","fill","count"], | ||
| + | ["circle",i=>300+pts[i][0],i=>300+pts[i][1],100,"black",1,i=>"transparent",pts.length] | ||
| + | ] | ||
| + | ) | ||
| + | "" | ||
| + | </syntaxhighlight> | ||
| + | [[File:Render_Circles_Around_Poly_Points.png]] | ||
| + | |||
| + | |||
| + | |||
| + | <syntaxhighlight lang="javascript"> | ||
| + | // circle around polygon points | ||
| + | pts=MAKEPOLYGONPOINTS(50,200) | ||
| + | .concat(MAKEPOLYGONPOINTS(50,100)) | ||
| + | .concat(MAKEPOLYGONPOINTS(50,150)) | ||
| + | RENDER( | ||
| + | [ | ||
| + | ["type","cx","cy","r","stroke","stroke-width","fill","count"], | ||
| + | ["circle",i=>300+pts[i][0],i=>300+pts[i][1],100,"black",1,i=>"transparent",pts.length] | ||
| + | ] | ||
| + | ) | ||
| + | "" | ||
| + | </syntaxhighlight> | ||
| + | [[File:Render_Circles_Around_Poly_Points_1.png]] | ||
| + | |||
| + | |||
| + | |||
| + | <syntaxhighlight lang="javascript"> | ||
| + | // circle around polygon points | ||
| + | pts=MAKEPOLYGONPOINTS(50,200) | ||
| + | .concat(MAKEPOLYGONPOINTS(50,100)) | ||
| + | .concat(MAKEPOLYGONPOINTS(50,150)) | ||
| + | RENDER( | ||
| + | [ | ||
| + | ["type","cx","cy","r","stroke","stroke-width","fill","count"], | ||
| + | ["circle",i=>300+pts[i][0],i=>300+pts[i][1],100,"black",1,"rgba(40,30,128,0.1)",pts.length] | ||
| + | ] | ||
| + | ) | ||
| + | "" | ||
| + | </syntaxhighlight> | ||
| + | [[File:Render_Circles_Around_Poly_Points_2.png]] | ||
| + | |||
| + | |||
| + | |||
| + | <syntaxhighlight lang="javascript"> | ||
| + | // circle around polygon points | ||
| + | pts=MAKEPOLYGONPOINTS(50,200) | ||
| + | .concat(MAKEPOLYGONPOINTS(50,100)) | ||
| + | .concat(MAKEPOLYGONPOINTS(50,150)) | ||
| + | RENDER( | ||
| + | [ | ||
| + | ["type","x","y","width","height","stroke","stroke-width","fill","count"], | ||
| + | ["rect",i=>300+pts[i][0],i=>300+pts[i][1],100,100,"black",1,"rgba(40,30,128,0.1)",pts.length] | ||
| + | ] | ||
| + | ) | ||
| + | "" | ||
| + | </syntaxhighlight> | ||
| + | [[File:Render_Circles_Around_Poly_Points_3.png]] | ||
| + | |||
| + | |||
| + | |||
| + | <syntaxhighlight lang="javascript"> | ||
| + | //Circles around polygon points - another patter | ||
| + | pts=MAKEPOLYGONPOINTS(50,100) | ||
| + | .concat(MAKEPOLYGONPOINTS(100,200)) | ||
| + | RENDER( | ||
| + | [ | ||
| + | ["type","cx","cy","r","stroke","stroke-width","fill","count"], | ||
| + | ["circle",i=>300+pts[i][0],i=>300+pts[i][1],50,"green",5,"rgba(40,30,128,0.1)",pts.length] | ||
| + | ] | ||
| + | ) | ||
| + | "" | ||
| + | |||
| + | </syntaxhighlight> | ||
| + | [[File:Render_Circles_Around_Poly_Points_4.png]] | ||
==Example 9 : Magic Square Mapping with Labels== | ==Example 9 : Magic Square Mapping with Labels== | ||
Magic Square Mapping with Labels | Magic Square Mapping with Labels | ||
| − | < | + | <syntaxhighlight lang="javascript"> |
RENDER( | RENDER( | ||
[ | [ | ||
| Line 184: | Line 285: | ||
) | ) | ||
"" | "" | ||
| − | </ | + | </syntaxhighlight> |
[[File:Render_Magic_Square_Mapping_with_Labels.png]] | [[File:Render_Magic_Square_Mapping_with_Labels.png]] | ||
| Line 190: | Line 291: | ||
Generates Analog Clock with Render Feature. | Generates Analog Clock with Render Feature. | ||
| − | < | + | <syntaxhighlight lang="javascript"> |
// clock | // clock | ||
clockx=RENDER( | clockx=RENDER( | ||
| Line 213: | Line 314: | ||
"" | "" | ||
| − | </ | + | </syntaxhighlight> |
[[File:Render_Clock.png]] | [[File:Render_Clock.png]] | ||
| Line 219: | Line 320: | ||
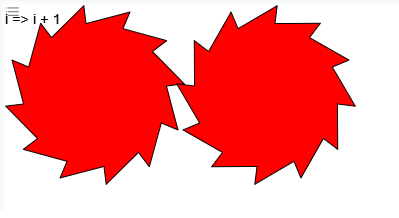
Generates Gears Animation. | Generates Gears Animation. | ||
| − | < | + | <syntaxhighlight lang="javascript"> |
gearsx=RENDER( | gearsx=RENDER( | ||
[ | [ | ||
| Line 239: | Line 340: | ||
"" | "" | ||
| − | </ | + | </syntaxhighlight> |
[[File:Render_Gears_Animation.png]] | [[File:Render_Gears_Animation.png]] | ||
| Line 246: | Line 347: | ||
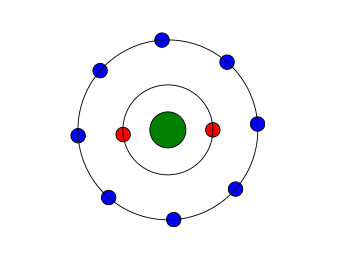
Generates Atomic Structure. | Generates Atomic Structure. | ||
| − | < | + | <syntaxhighlight lang="javascript"> |
Atomx=RENDER( | Atomx=RENDER( | ||
| Line 272: | Line 373: | ||
"" | "" | ||
"" | "" | ||
| − | </ | + | </syntaxhighlight> |
[[File:Render_Atomic_Structure.png]] | [[File:Render_Atomic_Structure.png]] | ||
| Line 279: | Line 380: | ||
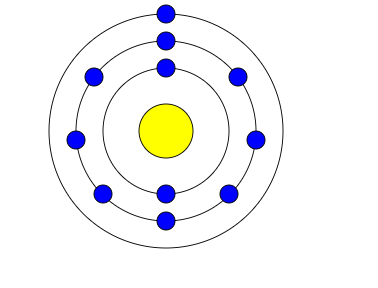
Generates Sodium structure with Render Feature | Generates Sodium structure with Render Feature | ||
| − | < | + | <syntaxhighlight lang="javascript"> |
RENDER( | RENDER( | ||
[ | [ | ||
| Line 306: | Line 407: | ||
) | ) | ||
"" | "" | ||
| − | </ | + | </syntaxhighlight> |
[[File:Render_Sodium_Structure.png]] | [[File:Render_Sodium_Structure.png]] | ||
| Line 312: | Line 413: | ||
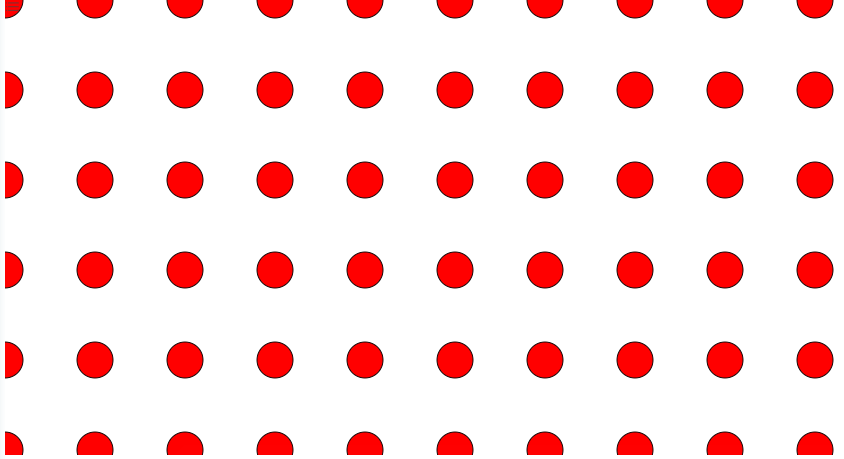
Gives the Grid of Circles. | Gives the Grid of Circles. | ||
| − | < | + | <syntaxhighlight lang="javascript"> |
GridPointsx=RENDER( | GridPointsx=RENDER( | ||
[ | [ | ||
| Line 322: | Line 423: | ||
"" | "" | ||
| − | </ | + | </syntaxhighlight> |
[[File:Render_Grid_of_Circles.png]] | [[File:Render_Grid_of_Circles.png]] | ||
| Line 328: | Line 429: | ||
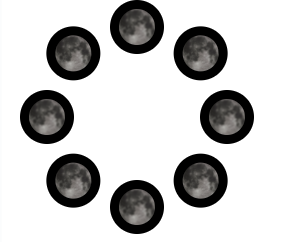
Generates the Phases of Moon (WIP) | Generates the Phases of Moon (WIP) | ||
| − | < | + | <syntaxhighlight lang="javascript"> |
PhasesOfMoon=RENDER( | PhasesOfMoon=RENDER( | ||
| Line 339: | Line 440: | ||
"" | "" | ||
| − | </ | + | </syntaxhighlight> |
[[File:Render_Phases_of_the_Moon(WIF).png]] | [[File:Render_Phases_of_the_Moon(WIF).png]] | ||
| Line 346: | Line 447: | ||
| − | < | + | <syntaxhighlight lang="javascript"> |
triangle=POLYPOINTS(3,100,100); | triangle=POLYPOINTS(3,100,100); | ||
s=LINESPLIT(triangle,10,true) | s=LINESPLIT(triangle,10,true) | ||
| Line 362: | Line 463: | ||
"" | "" | ||
| − | </ | + | </syntaxhighlight> |
[[File:Render_Triangle_Segment_Lines1.png]] | [[File:Render_Triangle_Segment_Lines1.png]] | ||
Larger Figure | Larger Figure | ||
| − | < | + | <syntaxhighlight lang="javascript"> |
triangle=POLYPOINTS(3,500,500); | triangle=POLYPOINTS(3,500,500); | ||
s=LINESPLIT(triangle,100,true) | s=LINESPLIT(triangle,100,true) | ||
| Line 382: | Line 483: | ||
RENDER(d) | RENDER(d) | ||
"" | "" | ||
| − | </ | + | </syntaxhighlight> |
[[File:Render_Triangle_Segment_Lines2.png]] | [[File:Render_Triangle_Segment_Lines2.png]] | ||
| Line 390: | Line 491: | ||
| − | < | + | <syntaxhighlight lang="javascript"> |
RENDER( | RENDER( | ||
[ | [ | ||
| Line 399: | Line 500: | ||
"" | "" | ||
| − | </ | + | </syntaxhighlight> |
[[File:Render_Gradient_Colors.png]] | [[File:Render_Gradient_Colors.png]] | ||
| − | < | + | <syntaxhighlight lang="javascript"> |
RENDER( | RENDER( | ||
[ | [ | ||
| Line 411: | Line 512: | ||
"" | "" | ||
| − | </ | + | </syntaxhighlight> |
[[File:Render_Gradient_Colors2.png]] | [[File:Render_Gradient_Colors2.png]] | ||
| − | < | + | |
| + | <syntaxhighlight lang="javascript"> | ||
RENDER( | RENDER( | ||
[ | [ | ||
| Line 421: | Line 523: | ||
) | ) | ||
"" | "" | ||
| − | </ | + | </syntaxhighlight> |
[[File:Render_Gradient_Colors3.png]] | [[File:Render_Gradient_Colors3.png]] | ||
| Line 430: | Line 532: | ||
Rounded Rectangle/Square | Rounded Rectangle/Square | ||
| − | < | + | <syntaxhighlight lang="javascript"> |
RENDER( | RENDER( | ||
| Line 442: | Line 544: | ||
"" | "" | ||
| − | </ | + | </syntaxhighlight> |
| − | |||
[[File:Rounded_Rectangle.png]] | [[File:Rounded_Rectangle.png]] | ||
| Line 451: | Line 552: | ||
Polygon | Polygon | ||
| − | < | + | |
| + | <syntaxhighlight lang="javascript"> | ||
RENDER( | RENDER( | ||
| Line 461: | Line 563: | ||
"" | "" | ||
| − | </ | + | </syntaxhighlight> |
[[File:Polygon.png]] | [[File:Polygon.png]] | ||
| Line 472: | Line 574: | ||
| − | < | + | <syntaxhighlight lang="javascript"> |
| Line 492: | Line 594: | ||
) | ) | ||
"" | "" | ||
| − | </ | + | </syntaxhighlight> |
| + | [[File:Render_Cardiod_from_Circles1.png]] | ||
Using color schemes to color the circles. More color schemes can be obtained using notations at [https://github.com/d3/d3-scale-chromatic d3-scale-chromatic] | Using color schemes to color the circles. More color schemes can be obtained using notations at [https://github.com/d3/d3-scale-chromatic d3-scale-chromatic] | ||
| − | < | + | <syntaxhighlight lang="javascript"> |
// circle around polygon points | // circle around polygon points | ||
noofpoints=50; | noofpoints=50; | ||
| Line 514: | Line 617: | ||
) | ) | ||
"" | "" | ||
| − | </ | + | </syntaxhighlight> |
| + | [[File:Render_Cardiod_from_Circles2.png]] | ||
Using color schemes such as d3.interpolateInferno. This takes a 0-1 range of value. | Using color schemes such as d3.interpolateInferno. This takes a 0-1 range of value. | ||
| − | < | + | <syntaxhighlight lang="javascript"> |
// circle around polygon points | // circle around polygon points | ||
noofpoints=50; | noofpoints=50; | ||
| Line 536: | Line 640: | ||
) | ) | ||
"" | "" | ||
| − | </ | + | </syntaxhighlight> |
| + | [[File:Render_Cardiod_from_Circles3.png]] | ||
Using Fill also using color scheme. | Using Fill also using color scheme. | ||
| − | < | + | <syntaxhighlight lang="javascript"> |
// circle around polygon points | // circle around polygon points | ||
noofpoints=50; | noofpoints=50; | ||
| Line 559: | Line 664: | ||
"" | "" | ||
| − | </ | + | </syntaxhighlight> |
| + | [[File:Render_Cardiod_from_Circles4.png]] | ||
=Additional Examples WIP= | =Additional Examples WIP= | ||
| Line 568: | Line 674: | ||
[[Various RENDER Examples| Various RENDER Examples]] | [[Various RENDER Examples| Various RENDER Examples]] | ||
| + | |||
| + | [[Colorsets#Color_Sets_for_Render_Functions| Additional Color Sets]] | ||
[[ Z3 | << Z3 home ]] | [[ Z3 | << Z3 home ]] | ||
| + | |||
| + | =Please do this change in entire page and in other parts of wiki, instead of pre to get highlight= | ||
| + | |||
| + | <syntaxhighlight lang="javascript"> | ||
| + | RENDER( | ||
| + | [ | ||
| + | ["type","size"], | ||
| + | ["circle",100], | ||
| + | ["circle",200] | ||
| + | ] | ||
| + | ) | ||
| + | </syntaxhighlight> | ||
Latest revision as of 04:37, 13 January 2022
ZCubes Render Examples
ZCubes Render feature allows users to make fascinatingly complex drawings and animations by simply using the spreadsheet, array or table features. To apply render to the last element, use RENDERX function.
Example 1: Two Circles
Draw two circles with radii as given.
RENDER(
   [
      ["type","size"],
      ["circle",100],
      ["circle",200]
   ]
)
Input data to render can also be given in alternative object formats or vertical formats. Alternative formats
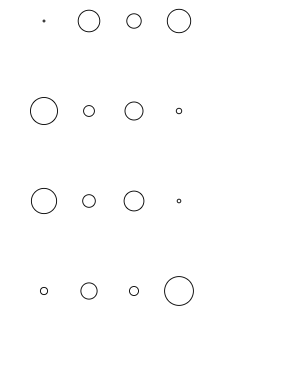
Example 2: Ten Circles
Draw ten circles with radii as per the function given. Note that each ith circle will have the radius as given by the function. Note the use of count column to specify the number of circles to be generated.
RENDER(
   [
      ["type","size","count"],
      ["circle",(i)=>100+i*10,10]
   ]
)
""
Example 3: American Flag
Generating American Flag using RENDER feature. // american flag 4 final
RENDER(
   [
      ["type","x","y",      "width","height","fill",            "count","shape","id","href","sides","size"],
      ["rect",10,(i)=>i*20,   400,   20,    (i)=>(i%2)?"white":"red"   ,13,,,,,],
      ["rect",10,   0,         200,   140,   "blue"                  ,1,,,,,],
      ["star",50,   0,         200,   140,   "white"                  ,1,true,"star11","","12",10],
      ["use",(i)=>((i)%6)*30+30,   (i)=>((i).intdiv(6))*25+15,         300,   140,   "white"                  ,6*5,false,"","star11","",300],
      ["use",(i)=>((i)%5)*30+20+25,   (i)=>((i).intdiv(5))*25+20+10,         300,   140,   "white"                  ,4*5,false,"","star11","",300]
   ]
)
""
Example 4: Indian Flag
Generating Indian Flag using RENDER feature.
RENDER(
   [
      ["type","x","y",      "width","height","fill",            "count","shape","id","href","sides","size","cx","cy","r","stroke","stroke-width","points","transform"],
      ["rect",10,(i)=>i*90,   400,   90,    ["orange","white","green"]   ,3,,,,,,],
      ["circle",,,,,      ,1,,,,,,200,135,40,"blue",5,],
      ["circle",,,,,      ,1,,,,,,200,135,5,"blue",10,],
      ["polyline",,,,,   "blue"   ,24,,,,,,,,,"blue",1,i=>[200,135,199,120, 200,95,201,120,200,135],(i=>({"rotation":(i+1)/24*360,"cx":200,"cy":135})) ],
   ]
);
""
Example 5: Graphics Model
   x=500..0..-10
   a=x.mergerows(0..0);
   b=x.mergerows(0..0).m(r=>r.reverse()).reverse();
   c=a.mergerows(b)
   d=c.m(r=>["line",r])
   ab=RENDER(d)
   e=d.map(r=>[r[0],[r[1][0],500-r[1][1],500-r[1][2],r[1][3]]])
   RENDER(e,ab)
   ""
Example 6: Magic Square
Magic Square Number Array Size Comparison
RENDER(
  [
	   ["type","r","cx","cy","count"],
		["circle",(i,j,d)=>d,(i,j,d)=>50+i*50,(i,j,d)=>50+j*100,MS(4)]
	]
 )
""
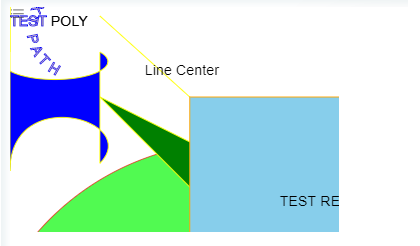
Example 7 :Animation Demo
Animation Demo
RENDER(
[
   ["type"   ,   "size"      ,   "coordinates"                  , "stroke"      , "fill"   , "label", "transform","animate","animationsettings"],
   ["circle"   ,   50      ,   [300,200]                  , "red"      , "yellow"   , "CenterOf", {translateX:100,rotate:50}],

   //[1   ,   100      ,   [100,100]                  , "red"      , "green"   , "CenterOf",
   //[1   ,   null      ,   null                  , "red"      , "green"   , "CenterOf",
   //[1   ,   null      ,   null                  , 'rgba(255, 0, 0, 0.7)'       , 'rgba(0, 255, 0, 0.7)'    , "CenterOf",
   //[1   ,   null      ,   [250,450]                  , 'rgba(255, 0, 0, 0.7)'       , 'rgba(0, 255, 0, 0.7)'    , "CenterOf",
   [1   ,   300      ,   [250,450]                  , 'rgba(255, 0, 0, 0.7)'       , 'rgba(0, 255, 0, 0.7)'    , "CenterOf",
      {translateX:50,rotate:90},
      "animate",
      {
         duration: 1000,
         delay: 1000,
         loop: true
         // when: 'now',
         // swing: true,
         // times: 5,
         // wait: 200
      }
   ],

   ["line"      ,   null   ,   [100,10,200,100]            , "yellow"   , "blue"   , "Line Center"   ],
   ["text"      ,   "HELLO"   ,   [300,200]                  , "yellow"   , "brown"   , ""         ],
   ["polygon"   ,   null   , [[100,100],[200,200],[300,200]]   , "yellow"   , "green"   , "TEST POLY"   ],
   ["path"      ,   null   , "M0 0 H50 A20 20 0 1 0 100 50 v25 C50 125 0 85 0 85 z"   , "yellow"   , "blue"   , "TEST POLY"   ],
   [null      ,   null   , "M0 0 V50 A60 20 0 1 0 100 50 v125 C150 125 0 85 0 185 z"   ,null   , null   , null,
      null,//{translateX:50,rotate:90},
      "animate",
      {
         duration: 1000,
         delay: 1000,
         loop: true
         // when: 'now',
         // swing: true,
         // times: 5,
         // wait: 200
      }
      ],
   ["rect"      ,   null   , [[200,100],[200,200]]            , "orange"   , "skyblue"   , "TEST RECT"   ],
   ["TEXTPATH"      ,   null   ,  "M0 0 H50 A20 20 0 1 0 100 50 v25 C50 125 0 85 0 85 z"            , "blue"   , "moccasin"   , "TEST TXT PATH"   ]
]
)
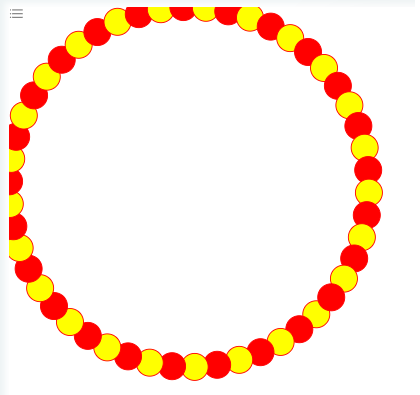
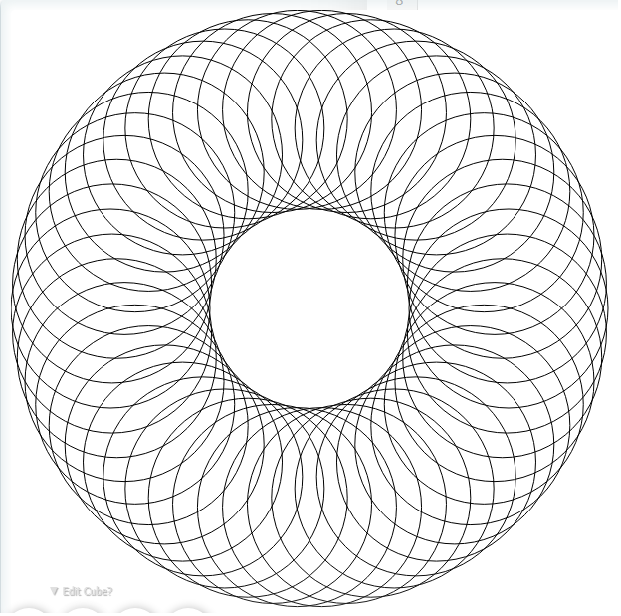
Example 8: Circles at Polygon Points
Circles at Polygon Points
// circle around polygon points
pts=MAKEPOLYGONPOINTS(50,200)
RENDER(
   [
      ["type","cx","cy","r","stroke","stroke-width","fill","count"],
      ["circle",i=>200+pts[i][0],i=>200+pts[i][1],15,"red",1,i=>i%2?"red":"yellow",pts.length]
   ]
)
""
// nics circles around polygon points
pts=MAKEPOLYGONPOINTS(50,200)
RENDER(
   [
      ["type","cx","cy","r","stroke","stroke-width","fill","count"],
      ["circle",i=>300+pts[i][0],i=>300+pts[i][1],100,"black",1,i=>"transparent",pts.length]
   ]
)
""
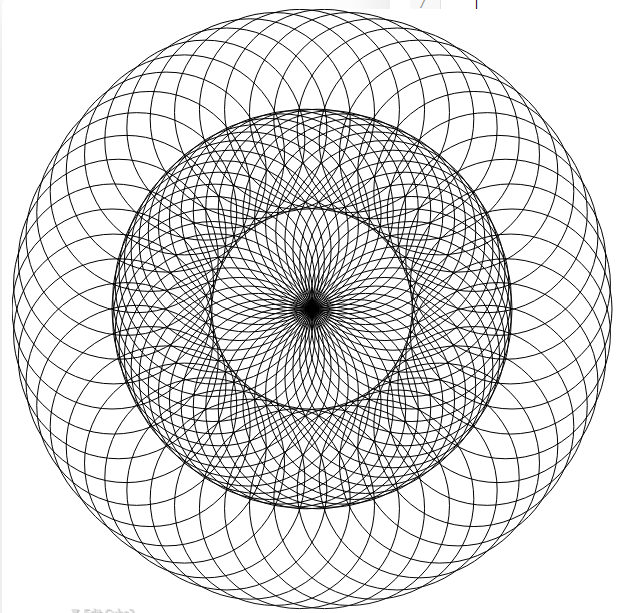
// circle around polygon points
pts=MAKEPOLYGONPOINTS(50,200)
.concat(MAKEPOLYGONPOINTS(50,100))
RENDER(
   [
      ["type","cx","cy","r","stroke","stroke-width","fill","count"],
      ["circle",i=>300+pts[i][0],i=>300+pts[i][1],100,"black",1,i=>"transparent",pts.length]
   ]
)
""
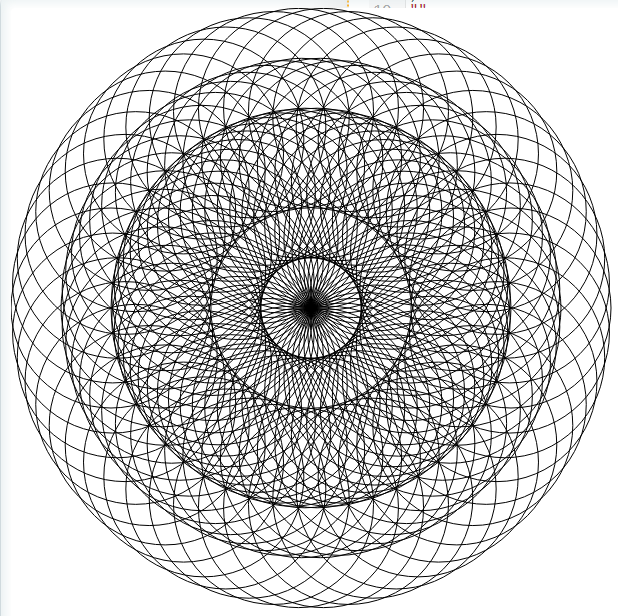
// circle around polygon points
pts=MAKEPOLYGONPOINTS(50,200)
.concat(MAKEPOLYGONPOINTS(50,100))
.concat(MAKEPOLYGONPOINTS(50,150))
RENDER(
   [
      ["type","cx","cy","r","stroke","stroke-width","fill","count"],
      ["circle",i=>300+pts[i][0],i=>300+pts[i][1],100,"black",1,i=>"transparent",pts.length]
   ]
)
""
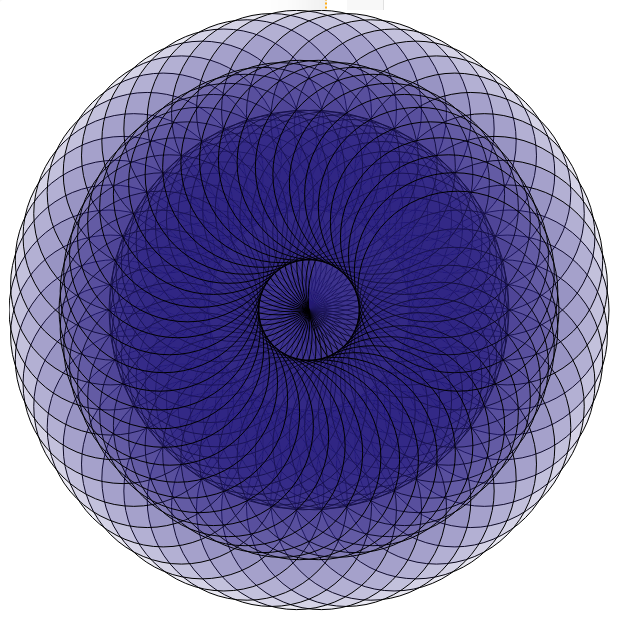
// circle around polygon points
pts=MAKEPOLYGONPOINTS(50,200)
.concat(MAKEPOLYGONPOINTS(50,100))
.concat(MAKEPOLYGONPOINTS(50,150))
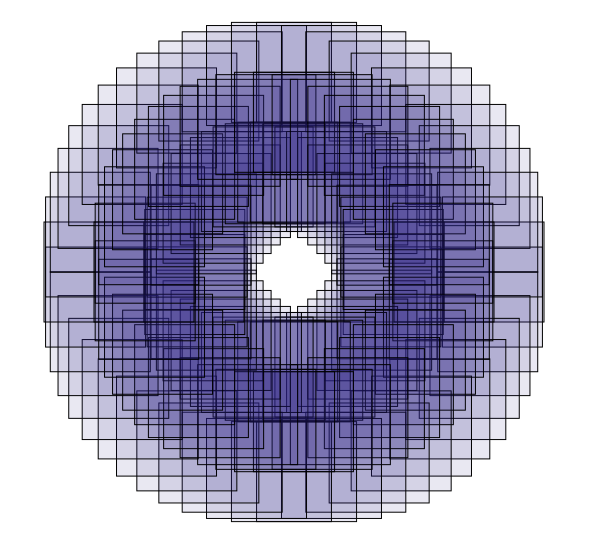
RENDER(
   [
      ["type","cx","cy","r","stroke","stroke-width","fill","count"],
      ["circle",i=>300+pts[i][0],i=>300+pts[i][1],100,"black",1,"rgba(40,30,128,0.1)",pts.length]
   ]
)
""
// circle around polygon points
pts=MAKEPOLYGONPOINTS(50,200)
.concat(MAKEPOLYGONPOINTS(50,100))
.concat(MAKEPOLYGONPOINTS(50,150))
RENDER(
   [
      ["type","x","y","width","height","stroke","stroke-width","fill","count"],
      ["rect",i=>300+pts[i][0],i=>300+pts[i][1],100,100,"black",1,"rgba(40,30,128,0.1)",pts.length]
   ]
)
""
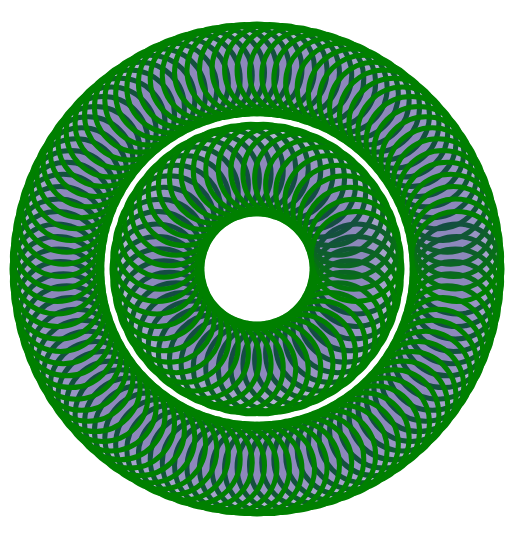
//Circles around polygon points - another patter
pts=MAKEPOLYGONPOINTS(50,100)
.concat(MAKEPOLYGONPOINTS(100,200))
RENDER(
   [
      ["type","cx","cy","r","stroke","stroke-width","fill","count"],
      ["circle",i=>300+pts[i][0],i=>300+pts[i][1],50,"green",5,"rgba(40,30,128,0.1)",pts.length]
   ]
)
""
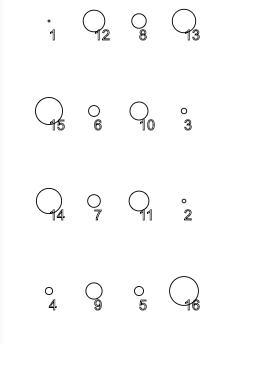
Example 9 : Magic Square Mapping with Labels
Magic Square Mapping with Labels
RENDER(
  [
	["type","r","cx","cy","label","count"],
	["circle",(i,j,d)=>d,(i,j,d)=>i*50+50,(i,j,d)=>j*100+50,(i,j,d)=>d+"",MS(4)]
  ]
)
""
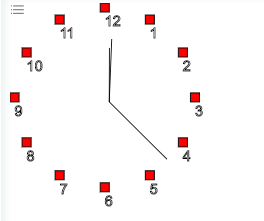
Example 10:Analog Clock
Generates Analog Clock with Render Feature.
// clock
clockx=RENDER(
	[
		["id","type","coordinates","width","height","fill","count","label","transform-origin"],
		["","rect",POLYPOINTS(12,100,100,-90+360/12),	10,10,"red",12,i=>i+1,],
		["hour","line",[110,110,110,50],	,,"blue",,,[110,110]],
		["minute","line",[110,110,110,40],	,,"green",,,[110,110]],
		["second","line",[110,110,110,20],	,,"red",,,[110,110]]
	]
);
RENDER(
	[
		["id","animate","animationsettings"],
		["hour"		,"animate",[["loop","rotate","duration","easing"],[true,360,12*60*60*1000,"linear"]]]	,
		["minute"	,"animate",[["loop","rotate","duration","easing"],[true,360,60*60*1000,"linear"]]],
		["second"	,"animate",[["loop","rotate","duration","easing"],[true,360,60*1000,"linear"]]]
	]
	,
	clockx
)
""
Example 11: Gears Animation
Generates Gears Animation.
gearsx=RENDER(
	[
		["id","type","points","width","height","fill","count","label","transform-origin"],
		["gear1","polygon",POLYPOINTS(12,100,100,-90+360/12).rowpush(POLYPOINTS(12,80,100,-90+360/12)).flatten().chunks(2),	10,10,"red",1,i=>i+1,[100,100]],
		["gear2","polygon",POLYPOINTS(12,100,[300-10,100],-90+360/12).rowpush(POLYPOINTS(12,80,[300-10,100],-90+360/12)).flatten().chunks(2),	10,10,"red",1,i=>i+1,[300-10,100]]
	]

);
RENDER(
	[
		["id"		, "animate","animationsettings"],
		["gear1"	, "animate",[["loop","rotate","duration","easing"],[true,-360,5*1000,"linear"]]]	,
		["gear2"	, "animate",[["loop","rotate","duration","easing"],[true,360,5*1000,"linear"]]]
	]
	,
	gearsx
)
""
Example 12: Atomic Structure
Generates Atomic Structure.
Atomx=RENDER(
	[
		["id"			,"class"		,"type"		,"coordinates"					,"r"	,"fill"	,"count","transform-origin"	,"cx"	,"cy"	, "animate"	,"animationsettings"		],
		[""				,"electrons1"	,	"circle",POLYPOINTS(2,50,200,-90+360/2) ,	8	,"red"	,2		,	[100,100]		,		,		,			,							],
		[""				,"electrons2"	,	"circle",POLYPOINTS(8,100,200,-90+360/8),	8	,"blue"	,8		,	[100,100]		,		,		,			,							],
		["nucleus"		,""				,	"circle",								,	20	,"green",		,	[100,100]		,200	,200	,			,							],
		["orbit1"		,""				,	"circle",								,	50	,		,		,	[100,100]		,200	,200	,			,							],
		["orbit2"		,""				,	"circle",								,	100	,		,		,	[100,100]		,200	,200	,			,							],
		[".electrons1"	,""				,	""		,								,		,		,		,					, 		,		,"animate"	,
																					[
																						["loop"	,"cx"		,"cy"		,"duration"	,"easing", "delay" ],
																						[true	,"#orbit1"	,"#orbit1"	,2*1000		,"linear",  anime.stagger(1000)	 ]
																					]
		],
		[".electrons2"	,""				,	""		,								,		,		,		,					, 		,		,"animate"	,
																						[
																							["loop"	,"cx"		,"cy"		,"duration"	,"easing", "delay" ],
																							[true	,"#orbit2"	,"#orbit2"	,8*1000		,"linear", anime.stagger(1000)	]
																						]
		]
	]
);
""
""
Sodium structure
Generates Sodium structure with Render Feature
RENDER(
   [
   	  ["type","x","y","fill","cx","cy","r","stoke","stoke-width"],
	   ["circle",,,,200,150,130,"yellow",30],
	   ["circle",,,,200,150,100,"yellow",30],
	   ["circle",,,,200,150,70,"yellow",30],

	   ["circle",,,"yellow",200,150,30,"yellow",30],

	   ["circle",,,"blue",200,80,10,"yellow",30],
	   ["circle",,,"blue",200,220,10,"yellow",30],


	   ["circle",,,"blue",200,50,10,"yellow",30],
	   ["circle",,,"blue",200,250,10,"yellow",30],
	   ["circle",,,"blue",100,160,10,"yellow",30],
	   ["circle",,,"blue",300,160,10,"yellow",30],
	   ["circle",,,"blue",120,90,10,"yellow",30],
	   ["circle",,,"blue",280,90,10,"yellow",30],
	   ["circle",,,"blue",270,220,10,"yellow",30],
	   ["circle",,,"blue",130,220,10,"yellow",30],

	   ["circle",,,"blue",200,20,10,"yellow",30],
   ]
)
""
Example 13: Grid of Circles
Gives the Grid of Circles.
GridPointsx=RENDER(
	[
		["id","type","coordinates","r","fill","count","transform-origin"],
		["","circle",GRIDPOINTS(10,100),	20,"red",IM(10),[100,100]]
	]

);
""
Example 14: Phases of Moon
Generates the Phases of Moon (WIP)
PhasesOfMoon=RENDER(
	[
		["id","type","coordinates","r","fill","count","transform-origin","stroke-width"],
		["","circle",POLYPOINTS(8,100,150,-90+360/8),	25,"https://upload.wikimedia.org/wikipedia/commons/thumb/e/e1/FullMoon2010.jpg/1024px-FullMoon2010.jpg",8,[100,100],10]
	]

);
""
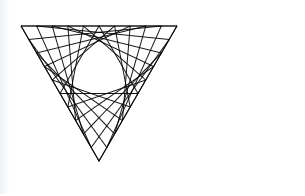
Example 15: Triangle Segment Lines
Generate Triangle Segment Lines.
triangle=POLYPOINTS(3,100,100);
s=LINESPLIT(triangle,10,true)
lines1=(s[0].rowpush(s[1])).m(r=>r.flatten())
lines2=(s[1].rowpush(s[2])).m(r=>r.flatten())
lines3=(s[2].rowpush(s[0])).m(r=>r.flatten())
var d=	[
			["type","coordinates","count"],
			["line",lines1,lines1.length],
			["line",lines2,lines2.length],
			["line",lines3,lines3.length]
		]

RENDER(d)
""
Larger Figure
triangle=POLYPOINTS(3,500,500);
s=LINESPLIT(triangle,100,true)
lines1=(s[0].rowpush(s[1])).m(r=>r.flatten())
lines2=(s[1].rowpush(s[2])).m(r=>r.flatten())
lines3=(s[2].rowpush(s[0])).m(r=>r.flatten())
var d=	[
			["type","coordinates","count"],
			["line",lines1,lines1.length],
			["line",lines2,lines2.length],
			["line",lines3,lines3.length]
		]

RENDER(d)
""
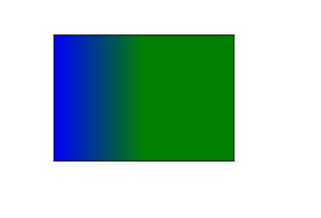
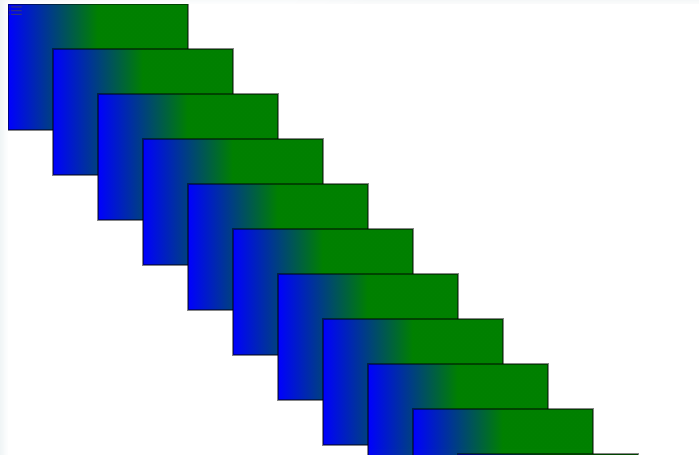
Example 16 : Gradient Colors
Generates Gradient Colors.
RENDER(
	[
		["type","x","y","width","height","fill"],
		["rect",100,100,200,140,["blue","green"]]
	]
)
""
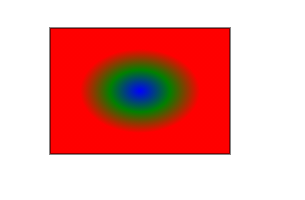
RENDER(
	[
		["type","x","y","width","height","fill"],
		["rect",100,100,200,140,["blue","green","red","radial"]]
	]
)
""
RENDER(
	[
		["type","x","y","width","height","fill","count"],
		["rect",i=>i*50,	i=>i*50,			200,140,i=>["blue","green"],12],
	]
)
""
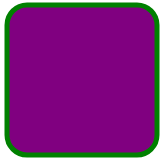
Example 17 : Rounded Quadrilaterals
Rounded Rectangle/Square
RENDER(
	[
		["type","x","y","rx","ry","width","height","fill","stroke","stroke-width"],
		["rect",50,20,20,20,150,150,"purple","green",5],

		]

	);
""
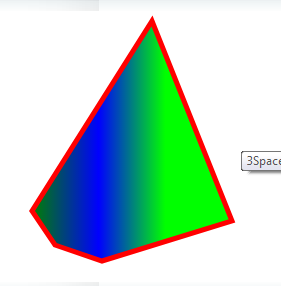
Example 18: Polygon
Polygon
RENDER(
	[
		["type","points","stroke","stroke-width","fill"],
		["polygon",[220,10 300,210 170,250 123,234,100,200,140],"red",5,["green","blue","lime"]],
	]
)
""
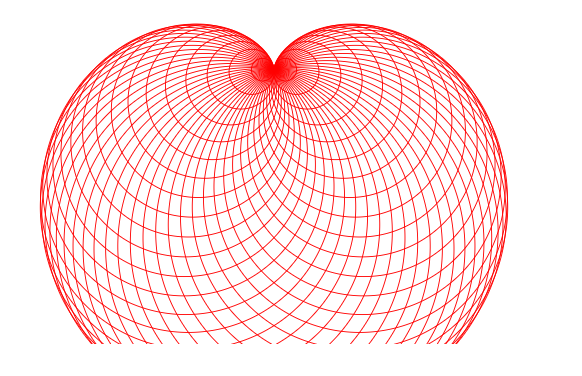
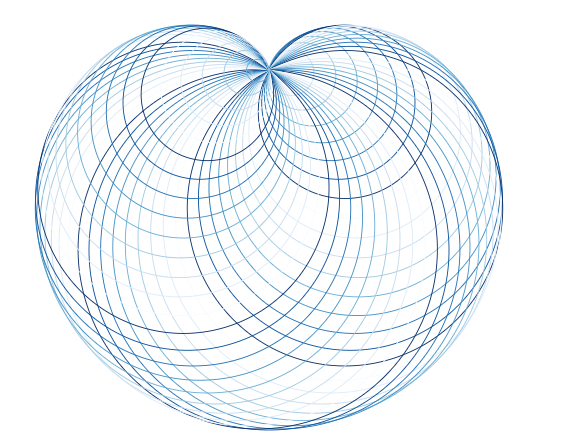
Example 19: Cardioid from Circles
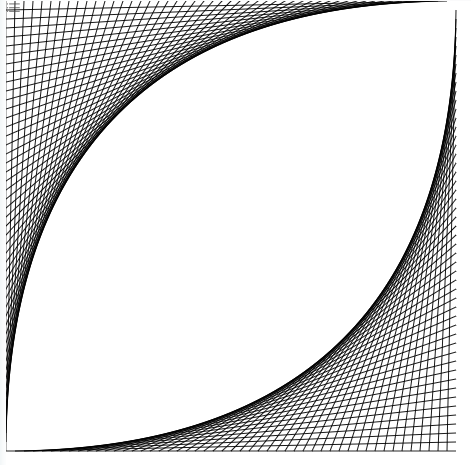
Points around a circle is then used to draw circles with radii that equals the distance between the point and the original first point on the circle.
Refer to [1] (A Cardioid as an Envelope of Lines) [It turns out that we can construct the cardioid as the envelope of curves, and we can do so in a number of different ways. For instance, pick a point P on a circle (the blue circle below, say). Draw circles with centers on the original circle that pass through P. The envelope of these circles is a cardioid.]
// circle around polygon points
noofpoints=50;
pts=MAKEPOLYGONPOINTS(noofpoints,[100,100],[300,300],-90)
start=pts[0];
circlesat=
	pts
		.map(
			p=>[p[0],p[1],SQRT(POWER(p[0]-start[0],2)+POWER(p[1]-start[1],2))]
		)

RENDER(
	[
		["type","cx","cy","r","stroke","stroke-width","count"],
		["circle",circlesat.column(0),circlesat.column(1),circlesat.column(2),"red",1,circlesat.length]
	]
)
""
Using color schemes to color the circles. More color schemes can be obtained using notations at d3-scale-chromatic
// circle around polygon points
noofpoints=50;
pts=MAKEPOLYGONPOINTS(noofpoints,[100,100],[300,300],-90)
start=pts[0];
circlesat=
	pts
		.map(
			p=>[p[0],p[1],SQRT(POWER(p[0]-start[0],2)+POWER(p[1]-start[1],2))]
		)

RENDER(
	[
		["type","cx","cy","r","stroke","stroke-width","count"],
		["circle",circlesat.column(0),circlesat.column(1),circlesat.column(2), d3.scaleOrdinal(d3.schemeBlues[9]),1,circlesat.length]
	]
)
""
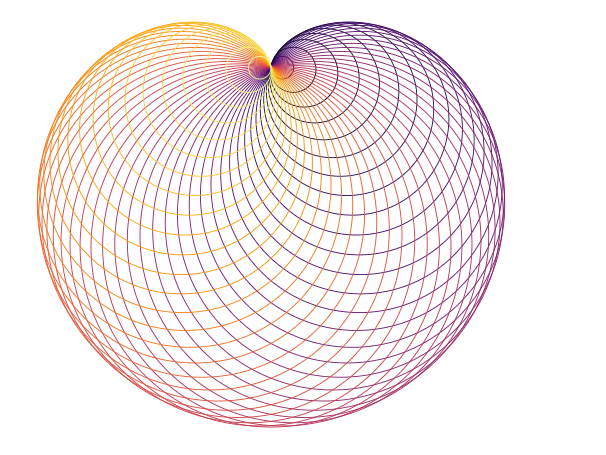
Using color schemes such as d3.interpolateInferno. This takes a 0-1 range of value.
// circle around polygon points
noofpoints=50;
pts=MAKEPOLYGONPOINTS(noofpoints,[100,100],[300,300],-90)
start=pts[0];
circlesat=
	pts
		.map(
			p=>[p[0],p[1],SQRT(POWER(p[0]-start[0],2)+POWER(p[1]-start[1],2))]
		)

RENDER(
	[
		["type","cx","cy","r","stroke","stroke-width","count"],
		["circle",circlesat.column(0),circlesat.column(1),circlesat.column(2), i=>d3.interpolateInferno(i/circlesat.length) ,1,circlesat.length]
	]
)
""
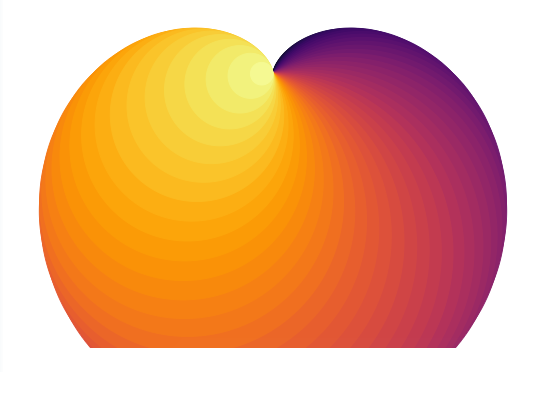
Using Fill also using color scheme.
// circle around polygon points
noofpoints=50;
pts=MAKEPOLYGONPOINTS(noofpoints,[100,100],[300,300],-90)
start=pts[0];
circlesat=
	pts
		.map(
			p=>[p[0],p[1],SQRT(POWER(p[0]-start[0],2)+POWER(p[1]-start[1],2))]
		)

RENDER(
	[
		["type","cx","cy","r","stroke","fill","stroke-width","count"],
		["circle",circlesat.column(0),circlesat.column(1),circlesat.column(2), i=>d3.interpolateInferno(i/circlesat.length) ,i=>d3.interpolateInferno(i/circlesat.length),1,circlesat.length]
	]
)
""
Additional Examples WIP
More illustrated RENDER examples
Please do this change in entire page and in other parts of wiki, instead of pre to get highlight
RENDER(
   [
      ["type","size"],
      ["circle",100],
      ["circle",200]
   ]
)
