Graphics Render Examples
Graphics Render Examples
Line and Triangle Examples
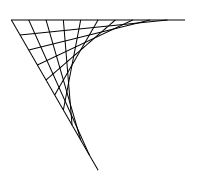
Points connecting two intersecting lines at an angle (or two sides of a triangle). Three sets of point coordinates for lines are generated with the function POLYPOINTS() and the lines are split to 10 segments to have ten points for each of the three line sets. Two lines are connected with the point sets on the lines diagonally opposite points
pointcoords=POLYPOINTS(3,100,100);
s=LINESPLIT(pointcoords,10,true)
lines1=(s[0].rowpush(s[1])).m(r=>r.flatten())
lines2=(s[1].rowpush(s[2])).m(r=>r.flatten())
lines3=(s[2].rowpush(s[0])).m(r=>r.flatten())
var d=	[
		["type","coordinates","count"],
		["line",lines1,lines1.length],
	]
RENDER(d) ""
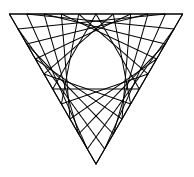
Lines are connected with the point sets on the lines diagonally opposite all three line sets
pointcoords=POLYPOINTS(3,100,100);
s=LINESPLIT(pointcoords,10,true)
lines1=(s[0].rowpush(s[2])).m(r=>r.flatten())
lines2=(s[1].rowpush(s[0])).m(r=>r.flatten())
lines3=(s[2].rowpush(s[1])).m(r=>r.flatten())
var d=	[	["type","coordinates","count"],
		["line",lines1,lines1.length],
		["line",lines2,lines2.length],
		["line",lines3,lines3.length]	]
RENDER(d) ""
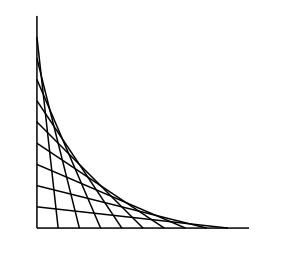
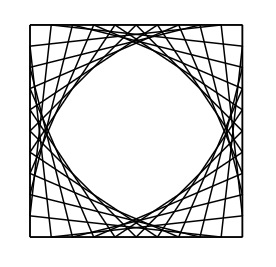
Four sets of point coordinates for lines are generated with the function POLYPOINTS() and the lines are split to 10 segments to have ten points for each of the four line sets. Lines are rendered with the set of points and the type of object to render, given to the RENDER function.
pointcoords=POLYPOINTS(4,100,100);
s=LINESPLIT(pointcoords,10,true)
lines1=(s[0].rowpush(s[1])).m(r=>r.flatten())
lines2=(s[1].rowpush(s[2])).m(r=>r.flatten())
lines3=(s[2].rowpush(s[3])).m(r=>r.flatten())
lines4=(s[3].rowpush(s[0])).m(r=>r.flatten())
var d=	[
		["type","coordinates","count"],
		["line",lines1,lines1.length]
	]

RENDER(d)
""
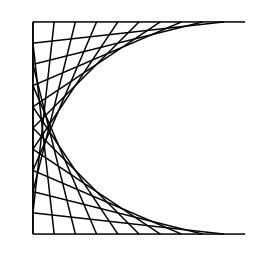
Two line sets rendered in this example.
pointcoords=POLYPOINTS(4,100,100);
s=LINESPLIT(pointcoords,10,true)
lines1=(s[0].rowpush(s[1])).m(r=>r.flatten())
lines2=(s[1].rowpush(s[2])).m(r=>r.flatten())
lines3=(s[2].rowpush(s[3])).m(r=>r.flatten())
lines4=(s[3].rowpush(s[0])).m(r=>r.flatten())
var d=	[	["type","coordinates","count"],
		["line",lines1,lines1.length],
		["line",lines2,lines2.length]
	]

RENDER(d)
""
Four line sets rendered in this example.
pointcoords=POLYPOINTS(4,100,100);
s=LINESPLIT(pointcoords,10,true)
lines1=(s[0].rowpush(s[1])).m(r=>r.flatten())
lines2=(s[1].rowpush(s[2])).m(r=>r.flatten())
lines3=(s[2].rowpush(s[3])).m(r=>r.flatten())
lines4=(s[3].rowpush(s[0])).m(r=>r.flatten())
var d=	[	["type","coordinates","count"],
		["line",lines1,lines1.length],
		["line",lines2,lines2.length],
		["line",lines3,lines3.length],
		["line",lines4,lines4.length]	]

RENDER(d)
""
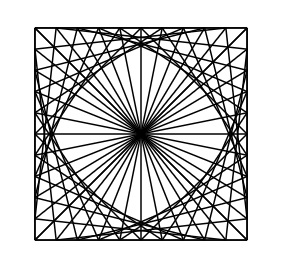
Four line sets and lines across are rendered in this example.
pointcoords=POLYPOINTS(4,100,100);
s=LINESPLIT(pointcoords,10,true)
lines1=(s[0].rowpush(s[1])).m(r=>r.flatten())
lines2=(s[1].rowpush(s[2])).m(r=>r.flatten())
lines3=(s[2].rowpush(s[3])).m(r=>r.flatten())
lines4=(s[3].rowpush(s[0])).m(r=>r.flatten())
lines5=(s[2].rowpush(s[0])).m(r=>r.flatten())
lines6=(s[1].rowpush(s[3])).m(r=>r.flatten())
var d=	[
		["type","coordinates","count"],
		["line",lines1,lines1.length],
		["line",lines2,lines2.length],
		["line",lines3,lines3.length],
		["line",lines4,lines4.length],
		["line",lines5,lines5.length],
		["line",lines6,lines6.length]
	]

RENDER(d)
""
Cardioid Examples
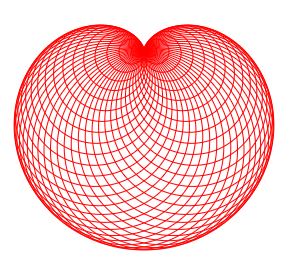
Following the "the midpoints of the circles lie on the perimeter of the fixed generator circle" method to draw a cardioid:
1) Choose a circle c and a point p on its perimeter, 2) Draw circles containing point p with centers on the perimeter of circle c
Example 1
numpoints=50;
pts=MAKEPOLYGONPOINTS(numpoints,[50,50],[200,200], 270)
start=pts[0];
circlesat=
	pts
		.map(
			p=>[p[0],p[1],SQRT(POWER(p[0]-start[0],2)+POWER(p[1]-start[1],2))]
		)

RENDER(
	[
		["type","cx","cy","r","stroke","stroke-width","count"],
		["circle",circlesat.column(0),circlesat.column(1),circlesat.column(2),"red",1,circlesat.length]
	]
)
""
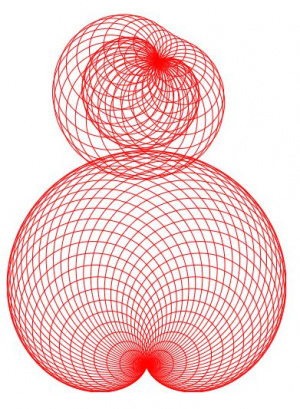
Example 2
numpoints=50;
pts=MAKEPOLYGONPOINTS(numpoints,[30,50],[200,200], 150)
start=pts[0];
circlesat1=
	pts
		.map(
			p=>[p[0],p[1],SQRT(POWER(p[0]-start[0],2)+POWER(p[1]-start[1],2))]
		)

pts=MAKEPOLYGONPOINTS(numpoints,[70,70],[500,200], 0)
start=pts[0];

circlesat2=
	pts
		.map(
			p=>[p[0],p[1],SQRT(POWER(p[0]-start[0],2)+POWER(p[1]-start[1],2))]
		)

cycloids = RENDER(
	[
		["id","type","cx","cy","r","stroke","stroke-width","count"],
		["cycloid1","circle",circlesat1.column(1),circlesat1.column(0),circlesat1.column(2),"red",1,circlesat1.length],
		["cycloid2","circle",circlesat2.column(1),circlesat2.column(0),circlesat2.column(2),"red",1,circlesat2.length]
	]
)
;
RENDER(
	[
		["id"		, "animate","animationsettings"],
		["cycloid1"	, "animate",[["loop","rotate","duration","easing"],[true,-360,5*1000,"linear"]]]	,
		["cycloid2"	, "animate",[["loop","rotate","duration","easing"],[true,360,5*1000,"linear"]]]
	]
	,
	cycloids
)
""
