More RENDER Examples
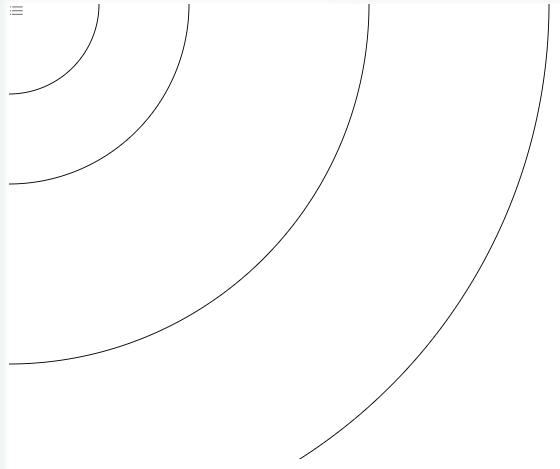
Segmented Render Arrays
Segmented Arrays with empty element. Each Segment can have its own heading
<syntaxhighlight lang="javascript"> RENDER(
[
["type","size"], ["circle",100], ["circle",200], [], ["type","size"], ["circle",400], ["circle",600]
]
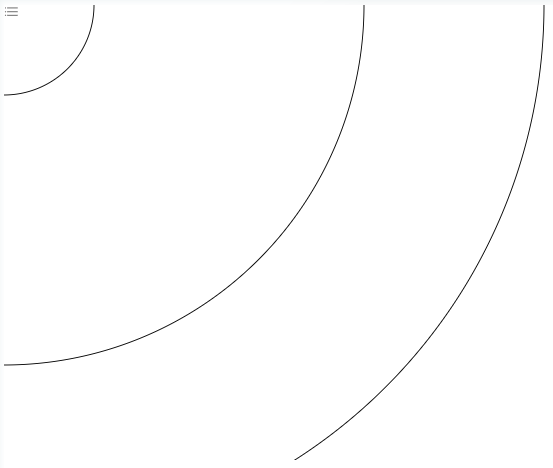
Timeline of Draw
<syntaxhighlight lang="javascript"> RENDER(
[
["timeline","type","size"], [,"circle",100], [10000,"circle",200], [], ["type","size"], ["circle",400], ["circle",600]
]
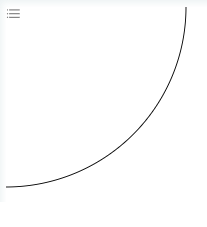
Drawing Strokes Simulation
<syntaxhighlight lang="javascript"> RENDER(
[
["timeline","type","size","draw"], [,"circle",100,true], [4000,"circle",200,true], [], ["type","size","draw"], ["circle",400,true], ["circle",600,true]
]
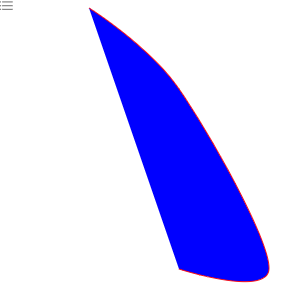
Line Modes
Line modes. Get modes from CURVEMODES() part of the string gives the mode like stepbefore
// edit: make name and info only below onto a table as Line Modes
<syntaxhighlight lang="javascript">
{name: 'curveLinear', curve: d3.curveLinear, active: true, lineString: , clear: false, info: 'Interpolates the points using linear segments.'}, {name: 'curveBasis', curve: d3.curveBasis, active: true, lineString: , clear: true, info: 'Interpolates the start and end points and approximates the inner points using a B-spline.'}, {name: 'curveBasisClosed', curve: d3.curveBasisClosed, active: false, lineString: , clear: false, info: 'Uses a closed B-Spline to approximate the points.'}, {name: 'curveBundle (ß=0)', curve: d3.curveBundle.beta(0), active: false, lineString: , clear: true, info: 'Same as curveBasis with the addition of a paramter ß which determines how close to a straight line the curve is. If ß=0 the curve is straight.'}, {name: 'curveBundle (ß=0.5)', curve: d3.curveBundle.beta(0.5), active: false, lineString: , clear: false, info: 'Same as curveBasis with the addition of a paramter ß which determines how close to a straight line the curve is.'}, {name: 'curveBundle (ß=1)', curve: d3.curveBundle.beta(1), active: false, lineString: , clear: false, info: 'Same as curveBasis with the addition of a paramter ß which determines how close to a straight line the curve is. If ß=1 the curve is the same as curveBasis.'}, {name: 'curveCardinal (tension=0)', curve: d3.curveCardinal.tension(0), active: false, lineString: , clear: true, info: "Interpolates the points using a cubic B-spline. A tension parameter determines how 'taut' the curve is. As tension approaches 1 the segments become linear."}, {name: 'curveCardinal (tension=0.5)', curve: d3.curveCardinal.tension(0.5), active: false, lineString: , clear: false, info: "Interpolates the points using a cubic B-spline. A tension parameter determines how 'taut' the curve is. As tension approaches 1 the segments become linear."}, {name: 'curveCardinal (tension=1)', curve: d3.curveCardinal.tension(1), active: false, lineString: , clear: false, info: "Interpolates the points using a cubic B-spline. A tension parameter determines how 'taut' the curve is. As tension approaches 1 the segments become linear."}, {name: 'curveCatmullRom (α=0)', curve: d3.curveCatmullRom.alpha(0), active: false, lineString: , clear: true, info: 'Similar to curveCardinal (tension=0) but with a parameter α that determines the parameterisation used to interpolate the points. If α=0 the parameterisation is uniform.'}, {name: 'curveCatmullRom (α=0.5)', curve: d3.curveCatmullRom.alpha(0.5), active: false, lineString: , clear: false, info: 'Similar to curveCardinal (tension=0) but with a parameter α that determines the parameterisation used to interpolate the points. If α=0.5 the parameterisation is centripetal and self intersecting loops are avoided.'}, {name: 'curveCatmullRom (α=1)', curve: d3.curveCatmullRom.alpha(1), active: false, lineString: , clear: false, info: 'Similar to curveCardinal (tension=0) but with a parameter α that determines the parameterisation used to interpolate the points. If α=1 the parameterisation is chordal.'}, {name: 'curveMonotoneX', curve: d3.curveMonotoneX, active: false, lineString: , clear: true, info: 'Interpolates the points with a cubic spline which are monotonic (i.e. always increasing or always decreasing) in y.'}, {name: 'curveMonotoneY', curve: d3.curveMonotoneY, active: false, lineString: , clear: false, info: 'Interpolates the points with a cubic spline which are monotonic (i.e. always increasing or always decreasing) in x.'}, {name: 'curveNatural', curve: d3.curveNatural, active: false, lineString: , clear: true, info: 'Interpolates the points with a cubic spline with zero 2nd derivatives at the endpoints.'}, {name: 'curveStep', curve: d3.curveStep, active: false, lineString: , clear: true, info: 'Interpolates the points with alternating horizontal and vertical linear segments. The vertical segments lie midway between points.'}, {name: 'curveStepAfter', curve: d3.curveStepAfter, active: false, lineString: , clear: false, info: 'Interpolates the points with alternating horizontal and vertical linear segments. The y value changes after the x value.'}, {name: 'curveStepBefore', curve: d3.curveStepBefore, active: false, lineString: , clear: false, info: 'Interpolates the points with alternating horizontal and vertical linear segments. The y value changes before the x value.'} <syntaxhighlight>
<syntaxhighlight lang="javascript"> RENDER( [ ["type" , "size" , "coordinates" , "stroke" , "fill" ,"linemode" ], ["line" , null , [100,10,200,100,300,299,200,300] , "red" , "blue" , "catmull"] ] ); ""
<syntaxhighlight>
Arrow Heads on Lines
marker-start marker-end marker-mid
<syntaxhighlight lang="javascript">
RENDER(
[
["type" , "size" , "coordinates" , "stroke" , "fill" , "marker-start"],
["line" , null , [100,10,200,100,300,299,200,300] , "red" , "blue" , "#arrow"]
]
);
""
<syntaxhighlight>
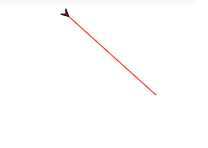
Arrow Heads on Lines and Line Modes
<syntaxhighlight lang="javascript"> RENDER( [ ["type" , "size" , "coordinates" , "stroke" , "fill" ,"linemode" ,"marker-end" ], ["line" , null , [100,10,200,100,300,299,200,300] , "red" , "blue" , "stepbefore","arrow"] ] ); "" <syntaxhighlight>
Arrow Heads at Start, End and Middle of Line
-arrows mid start and end
<syntaxhighlight lang="javascript">
RENDER( [ ["type" , "size" , "coordinates" , "stroke" , "fill" ,"linemode" ,"marker-end","marker-mid","marker-start" ], ["line" , null , [100,10,200,100,300,299,200,300] , "red" , "blue" , "stepbefore","arrow","arrow","arrow"] ] ); ""
<syntaxhighlight>
Timelines of Draw
Click the first circle, triggers the Section :1
<syntaxhighlight lang="javascript"> RENDER( [
 ["type","size","id"],
 ["circle",100,"d1"],
 ["circle",200],
 [],
 ["type"	,"trigger"	,"condition","goto"	, "target"	,"once"],
 ["event" 	,"onclick",(e)=>true	,":1" 	, "#d1"		,true], // click
 ["event" 	,"onkeydown",(e)=>e.keyCode=='K'	,":1" 	, ], // keydown or onkeydown
 ["done"], // ["."]
 [":1"],
 ["type","size"],
 ["circle",400],
 ["circle",600]
] ); ""
<syntaxhighlight>
Controls
Click the input control, triggers the Section :1
Note the use of [] empty cell to separate the sections. Use of :1 as section tags.
<syntaxhighlight lang="javascript"> RENDER( [
 ["type","size","id","value","trigger","goto"],
 ["input:button",100,"d1",343,"click",":1"],
 ["circle",200],
 ["."],
 [":1"],
 ["type","size"],
 ["circle",400],
 ["circle",600]
] ) ""
<syntaxhighlight>
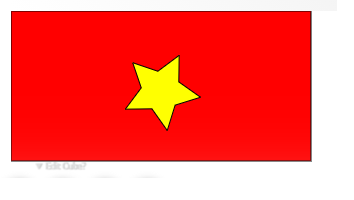
Flag of Vietnam
<syntaxhighlight lang="javascript"> RENDER(
  [
     ["type","x","y", "width","height","fill", "count","shape","id","href","sides","size"],

     ["rect",0, 0,  300,   150,   "red"  ,1,,,,,],
     ["star",0, 0,0, 0, "yellow",1,true,"star1","","10",40],

     ["use",150,80,300,140, "yellow",1,false,"","star1","",300],

     ]
)
""
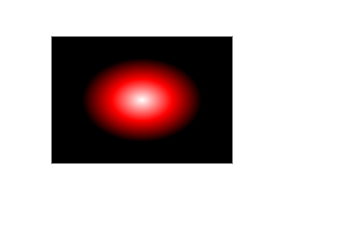
Gradient Colors
<syntaxhighlight lang="javascript">
RENDER(
[
["type","x","y","width","height","fill"],
["rect",100,70,200,140,["white","red","black","radial"]]
]
)
""
<syntaxhighlight>
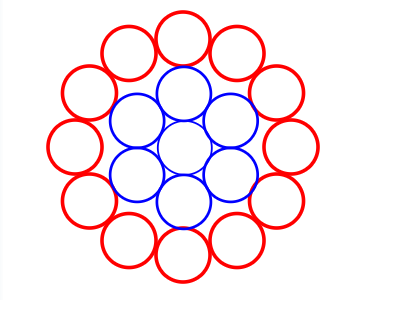
7 circles surrounded by 12 circles
<syntaxhighlight lang="javascript"> RENDER( [ ["id","type","coordinates","r","fill","count","transform-origin","stroke-width","stroke"], ["","circle",POLYPOINTS(12,120,200,-90+360/12),30,,12,[100,100],4,"red"], ["","circle",POLYPOINTS(6,60,201,-90+360/6),30,,6,[100,100],3,"blue"], ["","circle",POLYPOINTS(1,1,202,-90+360/1),30,,1,[100,100],2,"blue"]
]
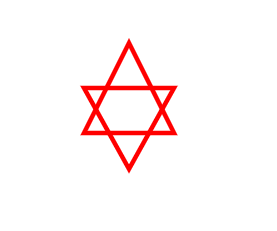
Triangle Star
<syntaxhighlight lang="javascript"> RENDER(
[
["type","points","stroke","stroke-width","fill"], ["polygon",[150,100,200,200,100,200],"red","5",], ["polygon",[200,150,100,150,150,240],"red","5",]
]
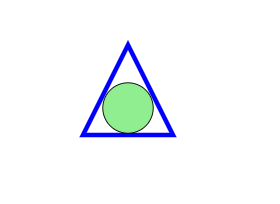
Circle Inside a Triangle
<syntaxhighlight lang="javascript"> RENDER(
[
["type","r","cx","cy","count","points","stroke","stroke-width","fill"], ["polygon",,,,,[150,100,200,200,100,200],"blue","5",], ["circle",28,150,170,1,,,,"lightgreen"]
]
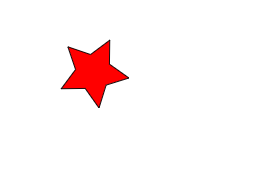
Rotating Star
<syntaxhighlight lang="javascript"> starx= RENDER(
  [
     ["type","x","y", "width","height","fill", "count","shape","id","href","sides","size"],
      ["star",0, 0,0, 0, "red",1,true,"star1","","10",40],
      ["use",150,80,300,140, "red",1,false,"","star1","",300],
  ]
); RENDER( [ ["id", "animate","animationsettings"], ["star1", "animate",[["loop","rotate","duration","easing"],[true,360,5*1000,"linear"]]],
]
,
starx
)
""
<syntaxhighlight>
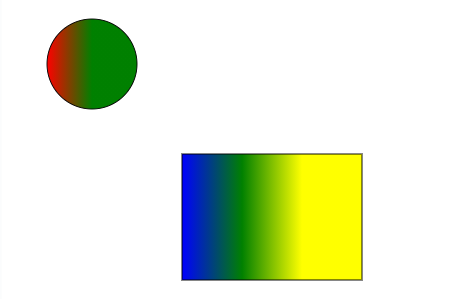
Circle and Rectangle with Gradiant
<syntaxhighlight lang="javascript"> RENDER( [ ["type","x","y","cx","cy","r","width","height","fill"], ["circle",,,100,100,50,200,140,["red","green"]], ["rect",200,200,,,,200,140,["blue","green","yellow"]]
]
)
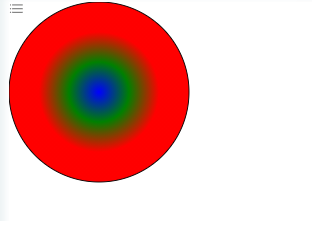
Circle with Radial
<syntaxhighlight lang="javascript">
RENDER(
[
["type","cx","cy","r","width","height","fill"],
["circle",100,100,100,200,140,["blue","green","red","radial"]]
]
)
""
<syntaxhighlight>
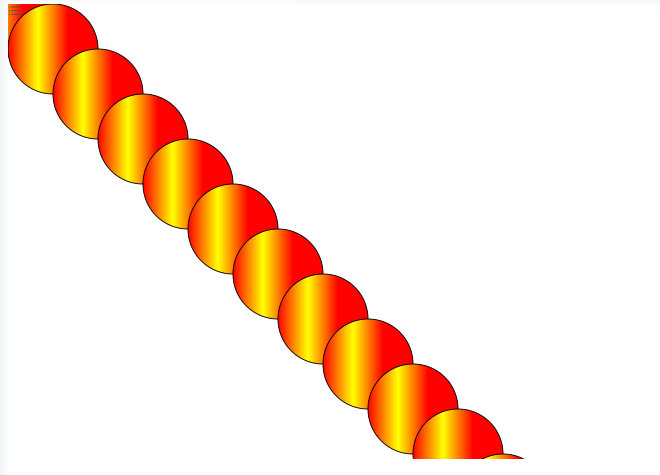
Circles with Gradiant
<syntaxhighlight lang="javascript">
RENDER(
[
["type","cx","cy","r","width","height","fill","count"],
["circle",i=>i*50, i=>i*50,50 , 200,140,i=>["red","yellow","red"],12],
]
)
""
<syntaxhighlight>
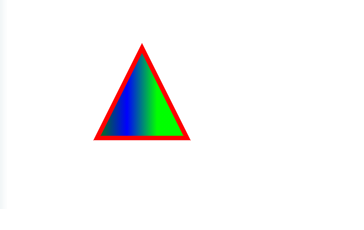
Triangle with Gradiant
<syntaxhighlight lang="javascript">
RENDER(
[
["type","points","stroke","stroke-width","fill"],
["polygon",[150,100 200,200 100,200],"red",5,["green","blue","lime"]],
]
)
""
<syntaxhighlight>
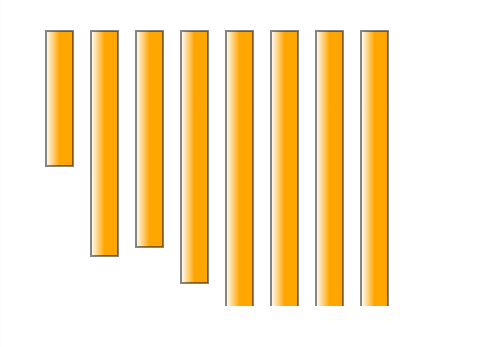
Bar Diagram
<syntaxhighlight lang="javascript"> RENDER(
  	[
         ["type","x","y","width","height","fill","sides","size","cx","cy","r"],
         ["rect", 50,200,   30,   150,    ["white","orange"]  , , , , ,],
["rect",100,200, 30, 250, ["white","orange"] , , , , ,],
["rect",150,200, 30, 240, ["white","orange"] , , , , ,],
["rect",200,200, 30, 280, ["white","orange"] , , , , ,], ["rect",250,200, 30, 325, ["white","orange"] , , , , ,], ["rect",300,200, 30, 380, ["white","orange"] , , , , ,], ["rect",350,200, 30, 350, ["white","orange"] , , , , ,], ["rect",400,200, 30, 700, ["white","orange"] , 40, 80,90 , 50,],
]
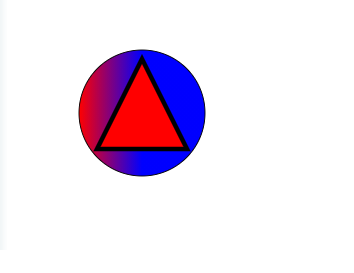
Triangle Inside the Circle with Gradiant
<syntaxhighlight lang="javascript"> RENDER( [ ["type","x","y","width","height","fill","cx","cy","r","points","stroke","stroke-width"], ["circle", , , ,,["red","blue"] ,150,160,70, , ,], ["polygon", , , , , "red", , , ,[150,100 200,200 100,200], ,5], ] ) "" <syntaxhighlight>
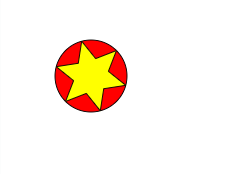
Star Inside Circle with Gradiant
<syntaxhighlight lang="javascript"> RENDER(
  	 [
          ["type","x","y","width","height","fill","count","shape","id","href","sides","size","cx","cy","r","stroke","stroke-width","points"],
      	   ["circle", , , , ,"red", , , , , , ,100,150,40],
["star",0,0,0,0,"yellow", 1,true , "star13", "","12",40], ["use",100,150,300,140,"yellow",1,false,"","star13","",300]
]
Lines with Coloured Circles
<syntaxhighlight lang="javascript"> RENDER(
  	[
     	["type","x","y","width","height","fill","count","shape","id","href","sides","size","cx","cy","r","stroke","stroke-width","points","transform"],
     	["circle",,,,,,1,,,,,,100,135,40,"red",10,],
     	["circle",,,,,,1,,,,,,100,135,5,"yellow",30,],
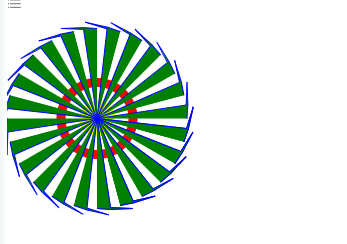
     	["polyline",,,,,"green",30,,,,,,,,,"blue",1,i=>[100,135,199,120, 200,95,201,120,200,135],(i=>({"rotation":(i+1)/24*360,"cx":100,"cy":135})) ],
  	]
