Difference between revisions of "Manuals/calci/FRACTAL"
Jump to navigation
Jump to search
| Line 1: | Line 1: | ||
| − | |||
| − | |||
| − | |||
| − | |||
| − | |||
| − | |||
| − | |||
| − | |||
| − | |||
| − | |||
| − | |||
| − | |||
| − | |||
| − | |||
| − | |||
| − | |||
| − | |||
| − | |||
| − | |||
| − | |||
| − | |||
| − | |||
| − | |||
| − | |||
| − | |||
| − | |||
| − | |||
| − | |||
| − | |||
| − | |||
| − | |||
| − | |||
| − | |||
| − | |||
| − | |||
| − | |||
| − | |||
| − | |||
| − | |||
| − | |||
| − | |||
<div style="font-size:30px">'''FRACTAL (Iterations,xmin,xmax,ymin,ymax,Width,Height,MandeliterFunction,Shades,CanvasId) '''</div><br/> | <div style="font-size:30px">'''FRACTAL (Iterations,xmin,xmax,ymin,ymax,Width,Height,MandeliterFunction,Shades,CanvasId) '''</div><br/> | ||
==Description== | ==Description== | ||
| − | *This function shows the fractal diagrams. | + | *This function shows the fractal diagrams based on the parameters. |
*Fractal is a curve or geometric figure, each part of which has the same statistical character as the whole. | *Fractal is a curve or geometric figure, each part of which has the same statistical character as the whole. | ||
*Fractals are useful in modeling structures such as eroded coastlines or snowflakes in which similar patterns recur at progressively smaller scales, and in describing partly random or chaotic phenomena such as crystal growth, fluid turbulence, and galaxy formation. | *Fractals are useful in modeling structures such as eroded coastlines or snowflakes in which similar patterns recur at progressively smaller scales, and in describing partly random or chaotic phenomena such as crystal growth, fluid turbulence, and galaxy formation. | ||
Revision as of 14:03, 12 September 2017
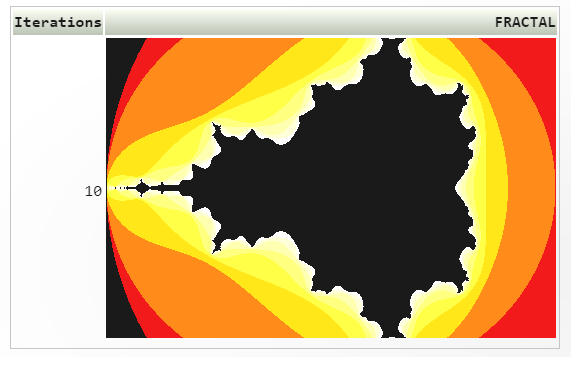
FRACTAL (Iterations,xmin,xmax,ymin,ymax,Width,Height,MandeliterFunction,Shades,CanvasId)
Description
- This function shows the fractal diagrams based on the parameters.
- Fractal is a curve or geometric figure, each part of which has the same statistical character as the whole.
- Fractals are useful in modeling structures such as eroded coastlines or snowflakes in which similar patterns recur at progressively smaller scales, and in describing partly random or chaotic phenomena such as crystal growth, fluid turbulence, and galaxy formation.
- Fractals are infinitely complex patterns that are self-similar across different scales.
- This property is called "self-similarity".
- Fractals form a never ending pattern, created by repeating a simple process over and over, in an ongoing feedback loop.
- The quality of the generated fractal improves with the accuracy used,as evident from the generated by example:10,100,1000@FRACTAL
