Difference between revisions of "Manuals/calci/BUBBLECHART"
Jump to navigation
Jump to search
(Created page with "<div style="font-size:30px">'''BUBBLECHART (Data,DisplayElement)'''</div><br/> *<math>Data</math> is the set of values. ==Description== *This function shows the Bubble Chart...") |
|||
| (One intermediate revision by the same user not shown) | |||
| Line 11: | Line 11: | ||
==Example== | ==Example== | ||
| + | #BUBBLECHART() | ||
| + | [[File:Bubblechart.png]] | ||
| + | |||
| + | ==Related Videos== | ||
| + | |||
| + | {{#ev:youtube|v=bUv_pEO9ZFc|280|center|Bubble Chart}} | ||
| + | |||
==See Also== | ==See Also== | ||
Latest revision as of 14:39, 4 March 2019
BUBBLECHART (Data,DisplayElement)
- Failed to parse (MathML with SVG or PNG fallback (recommended for modern browsers and accessibility tools): Invalid response ("Math extension cannot connect to Restbase.") from server "https://wikimedia.org/api/rest_v1/":): {\displaystyle Data} is the set of values.
Description
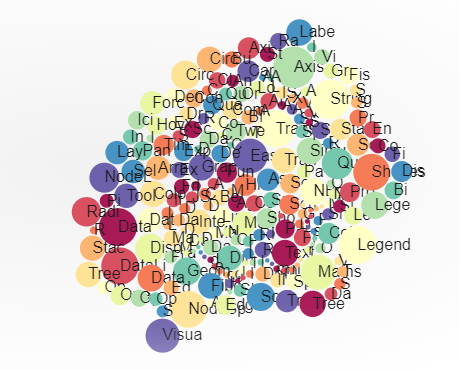
- This function shows the Bubble Chart for the given set of values.
- A series of bubbles on a map is called a cartogram or sometimes "bubble map".
- It is a multi-variable graph that is a cross between a Scatterplot and a Proportional Area Chart.
- Like a Scatterplot, Bubble Charts use a Cartesian coordinate system to plot points along a grid where the X and Y axis are separate variables.
- Too many bubbles can make the chart hard to read, so Bubble Charts have a limited data size capacity.
- Bubble charts can be considered a variation of the scatter plot, in which the data points are replaced with bubbles.
Example
- BUBBLECHART()
Related Videos
