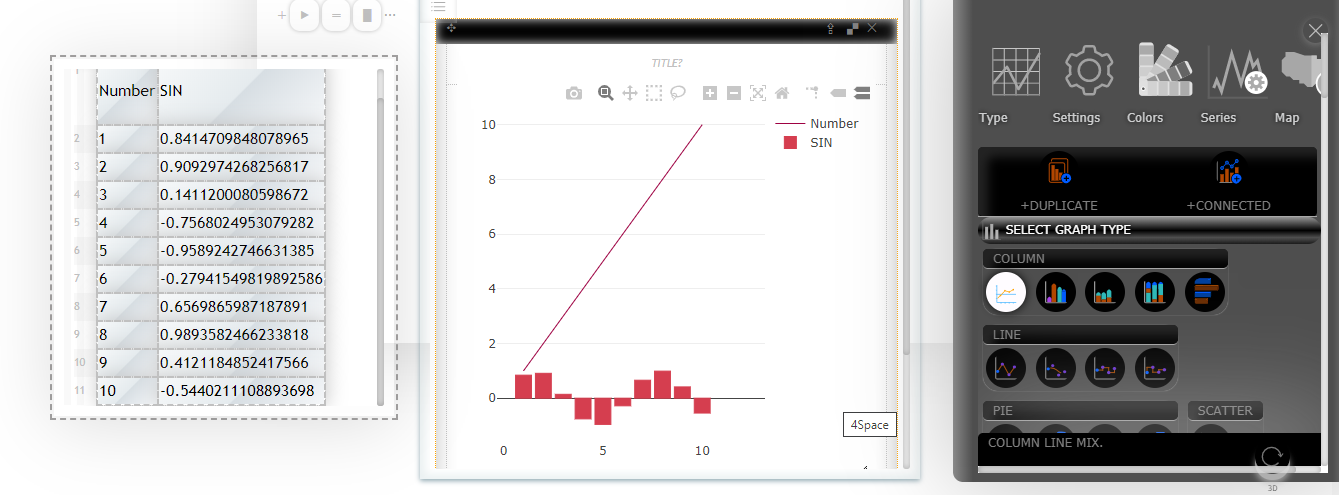
ZCubes/Column Line
Jump to navigation
Jump to search
Column Line Graph
Column graphs are used to compare values across categories using vertical lines. Column line graphs are ideal for tracking trends and predicting the yet-to-come values.
Input Range:
Consider SIN values from numbers 1 to 10.
SIN(1..10)
| Number | SIN |
| 1 | 0.8414709848078965 |
| 2 | 0.9092974268256817 |
| 3 | 0.1411200080598672 |
| 4 | -0.7568024953079282 |
| 5 | -0.9589242746631385 |
| 6 | -0.27941549819892586 |
| 7 | 0.6569865987187891 |
| 8 | 0.9893582466233818 |
| 9 | 0.4121184852417566 |
| 10 | -0.5440211108893698 |
See Also:
