ZCubes/Horizontal Column
Revision as of 05:21, 11 June 2020 by Swapna (talk | contribs) (Created page with " <<ZCubes Graphs ==Horizontal Column Graph== Horizontal graph are the graphs that represent the data horizontally. Here data categories are shown on vertical...")
Horizontal Column Graph
Horizontal graph are the graphs that represent the data horizontally. Here data categories are shown on vertical axis, whereas data values are shown on horizontal axis. All bars go across from left to right.
Input Range:
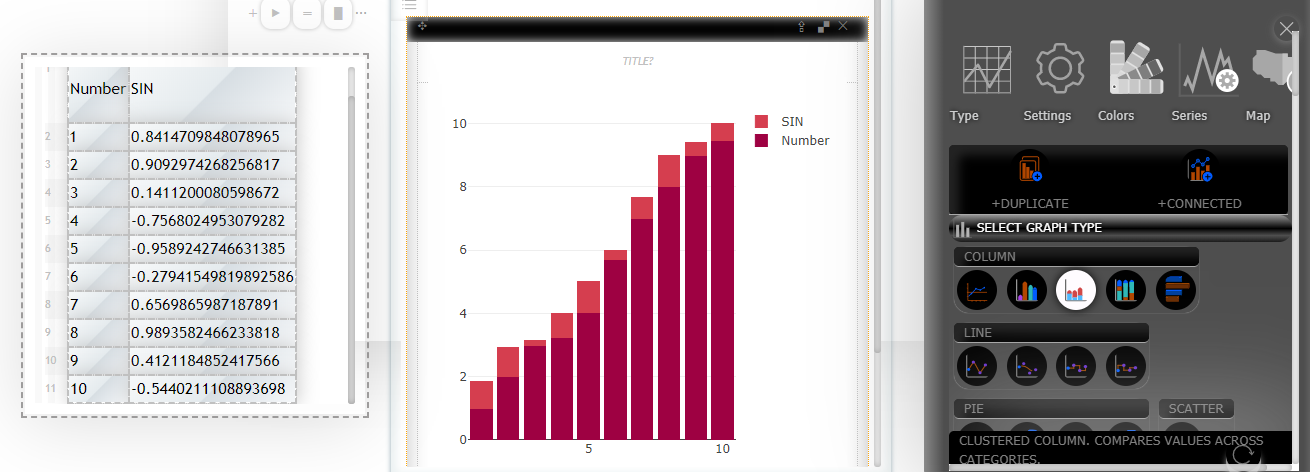
Consider SIN values from numbers 1 to 10.
SIN(1..10)
| Number | SIN |
| 1 | 0.8414709848078965 |
| 2 | 0.9092974268256817 |
| 3 | 0.1411200080598672 |
| 4 | -0.7568024953079282 |
| 5 | -0.9589242746631385 |
| 6 | -0.27941549819892586 |
| 7 | 0.6569865987187891 |
| 8 | 0.9893582466233818 |
| 9 | 0.4121184852417566 |
| 10 | -0.5440211108893698 |
See Also:
