Difference between revisions of "Manuals/calci/CHORDDIAGRAM"
Jump to navigation
Jump to search
| Line 14: | Line 14: | ||
==Examples== | ==Examples== | ||
#CHORDDIAGRAM() | #CHORDDIAGRAM() | ||
| − | + | [[File:Chorddiagram.png]] | |
| − | |||
==See Also== | ==See Also== | ||
Revision as of 14:17, 13 October 2017
CHORDDIAGRAM()
Description
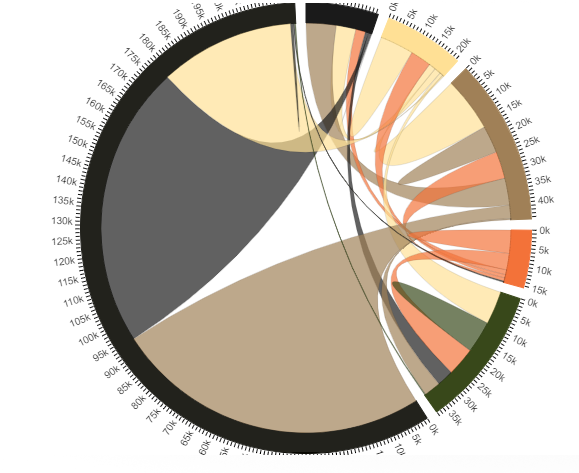
- This function shows the Chord Diagram.A chord diagram is a graphical method of displaying the inter relationships between data in a matrix.
- The connections between entities is used to display that they share something in common.
- This makes Chord Diagrams ideal for comparing the similarities within a dataset or between different groups of data.
- The data are arranged around a circle with the relationships between the data points typically drawn as arcs connecting the data.
- Values are assigned to each connection, which is represented proportionally by the size of each arc.
- Colour can be used to group the data into different categories, which aids in making comparisons and distinguishing groups.
- Over-cluttering becomes an issue with Chord Diagrams, which happens when there are too many connections displayed.
Examples
- CHORDDIAGRAM()
